Quantcast
Channel: Pedro's Tech Mumblings
Viewing all 63 articles
Browse latest View live

Game-development Log (7. Attack and explosions)

$
0
0

On my last post I've added interactivity to the units. On this post I'm taking it further by adding an attack option and corresponding explosions :)

First of all I've included an extra tank on the map that's not controllable by the player. Hence, a nice target to be attacked (although non-destructible).

The attack is triggered in the same way as a regular movement, by dragging the unit. When on-top of another unit it changes to an attack cursor, showing additional info.

Live Link: http://site-win.azurewebsites.net/Map/V5


I've implemented the explosion using the particle lib at http://scurker.com/projects/particles/


To place the explosion on Bing Maps I've used the pushpin's "htmlContent" property to create a new canvas where the explosion is rendered.

I've also used a custom html pushpin to display the attack details. For now only the range isn't hardcoded.

And that's it for now.


Game-development Log (8. Performance Checkpoint - I)

$
0
0

I don't want to have my full architecture set up only to realise that something isn't really scalable or performs sub-par. Thus, time for a performance checkpoint where I'm reviewing some of my bottlenecks and try to fix them.

Live-version: http://site-win.azurewebsites.net/Map/V7

Zoomed-out tile images

Currently my image tiles are generated dynamically per request and stored on the Azure CDN. Although this is quite interesting from a storage point-of-view/setup time it has a drawback: the time it takes to generate an image on the furthest away zoom levels, particularly for the unlucky users that get cache misses on the CDN.

The reason is quite-simple: a tile at zoom level 7 includes about 16.000 individual hexagons, requiring some time (like a couple of seconds) to render. For comparison, a tile at zoom level 12 includes about 30 hexagons and is blazing fast to render.


Pre-generating everything is not an option so I opted for an hybrid-approach:
  • Between zoom levels 7 and 10 (configurable) I generate the tile images and store them on Azure's blob storage with a CDN fetching from it.
  • After 11+ they're generated dynamically and stored on the CDN (as they were)
So in practice I now have two different urls on my map:
So the question is: how many tiles will I need to pre-generate?

The math is quite straight-forward:

tiles for zoom level n = 4^n

tiles 7 = 4^7 = 16.384
tiles 8 = 4^8 = 65.536
tiles 9 = 4^9 = 262.144
tiles 10 = 4^10 = 1.048.576

total = 1.392.640

As I only generate tiles with data, and considering that 2/3 of the planet is water, the approximate number of hexagons generated would be:

approximate number = total * 0.33 ~ 460.000 images

Not too bad and completely viable, particularly as I don't expect to be re-generating these images very often.

Vector-Load to support unit movement

Something that I was noticing is that panning the map view on higher zoom levels was a little bit sluggish, particularly as it was loading the vector tiles with the hexagon data in order to calculate the movement options of the units.

I was loading this info per-tile during panning, which was blocking the UI thread. A colleague of mine suggested me to try something else: HTML5 Web Workers. You basically spawn a worker thread that is able to do some work (albeit with some limitations, like not being able to access the DOM) and using messaging to communicate with the main UI thread.

The implementation was really straightforward and I've deployed it to Azure at:
http://site-win.azurewebsites.net/Map/V6

Unfortunately I didn't really notice any performance improvement. Anyway, Web Workers could be an incredibly viable alternative if I ever switch to a client-based drawing logic instead of completely server-side. I've added an entry to my backlog for some WebGL experiments with this :)

I then had a different idea: instead of loading the hexagon-data tile by tile make a single request that would include the various tiles that compose the current viewport. This is triggered on the "viewchangeend" Bing Maps event, particularly using a throttled event handler.

There was a small performance benefit on this approach and it can be further optimised, particularly leveraging local-storage on the client.

Change from PNG to JPEG

At a certain point in time my tiles required transparencies but that's no longer the case. Thus, and although being hit with a small quality downgrade, I've changed my image tiles from PNG to JPEG.

This has 3 advantages:

  • Storing the images on the CDN/Blob Storage will be cheaper as the JPEG images are considerably smaller
  • Latency on loading the image tiles
  • A more subtle advantage happens on the rendering process, as JPEG is faster to load and process, especially when the PNG counterpart has an alpha-channel.

The drawback is, as mentioned, image-quality. Here's a PNG image tile and the corresponding JPEG.


Highly compressed and noticeable image-loss but on the map as a whole is mostly negligible, particularly if there's no reference to compare. I'm more worried with performance than top-notch image quality.

Working version with the various improvements at: http://site-win.azurewebsites.net/Map/V7

Game-development Log (9. "Bootstraping")

$
0
0

This will be a short one. I'm basically picking up my map page and adding a bootstrap template around it.

I'm not tweaking it too much, just adding a couple of navigation buttons, some modals and some cosmetic details (like a subtle transparency on the navigation bar).

Without Bootstrap:
http://site-win.azurewebsites.net/Map/V7


With Bootstrap:
http://site-win.azurewebsites.net/Map/V8


Some buttons on the navbar already open some modals but it's mostly a placeholder for the functionality, like the Sign in one.


Also, Boostrap provides, out-of-the-box, responsive design. Thus the mobile-like display looks like:


So, nothing too fancy but I really love the "cleaness" that Bootstrap provides. I still need to tweak the UI a little bit but I'm not expecting it to change that much.

Game-development Log (10. Real-time with SignalR)

$
0
0

On this iteration I'm adding real-time notifications to the unit movement using the (awesome) SignalR library.

The idea for this will be simple: if a player moves a unit on his browser window all the others players will see that unit move in realtime on their browsers.

Let me first start by sharing the end-result, available at:
http://site-win.azurewebsites.net/Map/V9

I've created an ultra-simple video demoing it. I've opened three separate browser windows: one with Chrome, Firefox and Safari. The movement of the units should be synchronised in real-time across the various browsers, regardless of the one that triggered the movement.


So, how was this setup? Easy as pie.

1. Add SignalR NuGet package
install-package Microsoft.AspNet.SignalR

2. Initialise SignalR on the Startup routine of ASP.NET MVC 5 (on previous versions it's slightly different)
public partial class Startup
{
public void Configuration(IAppBuilder app)
{
app.MapSignalR();
}
}
3. Create a Hub
My hub will be ultra simple. It will simply receive a movement notification and share it with all the other SignalR clients as is.
public class UnitHub : Hub
{
public void SetPosition(dynamic unitdata)
{
Clients.Others.unitUpdated(unitdata);
}
}

4. Create Javascript code both to send a SignalR message when the player moves a unit or when a notification of another player moving a unit has been received.
//code to receive notification from server
unitUpdated = function (unit) {
// (...)
};

// Code to submit to server
server.setPosition(unit);
5. (Optional) If you're using Azure, you should enable WebSockets on your website.
And that's it.

Please note that I haven't yet added persistence nor support for different users. Thus, everyone will be moving the same units. Anyway, I don't have that many page views on my blog for it to be a problem :)

So, what's next?
- Adding a database to persist the units position
- Adding users, each with his own units.
- Authentication with Facebook, Twitter, Google, Windows, Email

Game-development Log (11. Persistence and Authentication)

$
0
0

Work-in-progress: https://site-win.azurewebsites.net

On this new iteration the units now have owners. A user can only move his own units (represented in blue) and won't be able to change the other player's units (represented in red).

Authentication

I've used the default template that comes with ASP.NET MVC 5. It includes most of the logic to create and manage users, integrate with Facebook/Google/Twitter, including persistence support with Entity Framework.

I did have to tweak it but most was actually pretty simple. Here's the end-result:
  • I've added register/log in buttons at the top.

  • After Log-in/Register the username is displayed, included a dropdown menu with additional options. The "Profile" button opens a new page to link between local and external accounts and to change the password.


The aesthetic still needs tons of work, but at least most of the functionality is there. Currently I only allow local users, Facebook and Google.

Persistence

The unit movement is now persisted on a SQL Server database at Azure, using Entity Framework. To validate it just move an unit and refresh the browser.


Add Units

I've added a "Developer" menu. Currently it allows units to be created on the map.


HTTPS (and CDN)

As I've added authentication to the site I've changed everything from HTTP to HTTPS. Unfortunately, although Azure's CDN supports HTTPS endpoints, it gets much slower than its HTTP counterpart. Also, I was getting random 503 responses.

So, for now, I've removed my usage of Azure's CDN altogether, either pointing to the blob storage for the static image tiles or to the Tile-Service webAPI for the dynamic ones.

I really love Azure, but its CDN really sucks, particularly comparing against the likes of Amazon, Cloudfront, Akamai, Level3, etc.

Splitting vector and raster files in QGIS programmatically

$
0
0
On the context of the game I'm developing I have to load gigantic .shp/.tif files and parse them to hexagons.

The problem is that this operation is executed in memory (because I need to consolidate/merge data) and the process fails with large files. I had two options:
  • Change the process so that it would store the preliminary results on a separate datastore
  • Instead of loading full shapefiles or raster images, split them into smaller chunks
I did try the first option and, although working, became so much slower (like 100x) that I had to discard it (or at least shelve it while I searched for a better alternative).

I also tried the smaller chunks approach and started by creating "packages" per Country, manually picking data from sources such as Geofabrik.

But this posed two problems:
    • Very tedious work, particularly as there are hundreds of countries.
    • Wouldn't work for larger countries, hitting the memory roadblock as well.
So I opted to split the files in a grid like manner. I decided to use QGIS as it provides all the required tooling.  

Doing this splitting is quite easy to do manually:

1. Open the shapefile (For this example I'm using Countries data from NaturalEarth).


2. Generate a grid.
  • Open the toolbox

  • Choose Geoalgorithms > Vector > Creation > Create graticule
  • Set the desired size (in degrees per rectangle) and set Grid type to Rectangle (polygon)

  • A grid is created over the map (I've changed the opacity of the grid layer to show the map beneath).

3. Select one of the rectangles


4. Perform an intersection between both layers
  • Choose Vector > Geoprocessing Tools > Intersect

  • Choose the base layer as input and the rectangle as the intersect layer, using the "Use only selected features" option.
  • After executing a new layer is created with the intersecting polygons


Now I would just need to repeat this for all the 648 grid items x number of layers to process. I'm assuming this would take about 1 minute per each one and about 10 layers. So, approximately 108 hours non-stop... Not going to happen :). So, what about automating this inside QGIS?

QGIS does provide a command-line/editor/plugins to programmatically leverage its functionalities. Unfortunately for me, it's in Python, which I had never used before. Regardless, the optimistic in me jumped at the opportunity to learn something new.

So, here it is, a sample Python script for QGIS that basically mimics the manual steps I did above:
  • Generates a grid (size hardcoded)
  • Iterates the various tiles in the grid
    • Iterates all layers currently visible (both raster and vector)
      • Outputs the intersection between the layer and the tile
      • Creates a subfolder (harcoded) with all the intersected layers for each tile.
    Complete code (update: there's a newer implementation on the bottom)

    import processing
    import os

    #Create a GRID
    result = processing.runalg("qgis:creategrid", 1, 360, 180, 10, 10, 0, 0, "epsg:4326", None)

    #Add it to the canvas
    gridLayer = iface.addVectorLayer(result.get("OUTPUT"),"grid","ogr")

    #Iterate ever square on the grid
    i = 0
    for square in gridLayer.getFeatures():
    i = i + 1

    #Create a new layer
    newSquareLayer = iface.addVectorLayer("Polygon?crs=epsg:4326", "temporary_polygon_" + str(i), "memory")
    provider = newSquareLayer.dataProvider()

    #feature that simply holds one square
    newSquare = QgsFeature()
    newSquare.setGeometry( QgsGeometry.fromPolygon(square.geometry().asPolygon()))
    provider.addFeatures( [ newSquare ] )

    #Make sure the target folder exists
    folder = "c:\\temp\\grid\\grid_" + str(i)
    if not os.path.exists(folder):
    os.makedirs(folder)

    #iterate the various layers except the grid
    for mapLayer in iface.mapCanvas().layers():

    layerType = mapLayer.type()
    layerName = mapLayer.name()
    intersectionName = "intersection_" + layerName + "_" + str(i)

    #vector layers and raster layers are processed differently
    if layerType == QgsMapLayer.VectorLayer and layerName != "grid":

    #Calculate the intersection between the specific grid rectangle and the layer
    intersection = processing.runalg("qgis:intersection", mapLayer, newSquareLayer, None)

    iface.addVectorLayer(intersection.get("OUTPUT"),intersectionName,"ogr")

    #create a shapefile for this new intersection layer on the filesystem.
    #A separate folder will be added for each square
    intersectionLayer = QgsMapLayerRegistry.instance().mapLayersByName(intersectionName)[0]
    QgsVectorFileWriter.writeAsVectorFormat(
    intersectionLayer,
    folder + "\\" + layerName + ".shp",
    "utf-8",
    QgsCoordinateReferenceSystem(4326),
    "ESRI Shapefile")

    #remove the intersection layer from the canvas
    QgsMapLayerRegistry.instance().removeMapLayers( [intersectionLayer.id()] )

    elif layerType == QgsMapLayer.RasterLayer:

    #Calculate the intersection between the specific grid rectangle and the raster layer
    intersection = processing.runalg('saga:clipgridwithpolygon', mapLayer, newSquareLayer, None)

    #add the intersection to the map
    iface.addRasterLayer(intersection.get("OUTPUT"), intersectionName)

    #export to file
    intersectionLayer = QgsMapLayerRegistry.instance().mapLayersByName(intersectionName)[0]

    pipe = QgsRasterPipe()
    provider = intersectionLayer.dataProvider()
    pipe.set(provider.clone())

    rasterWriter = QgsRasterFileWriter(folder + "\\" + layerName + ".tif")
    xSize = provider.xSize()
    ySize = provider.ySize()

    rasterWriter.writeRaster(pipe, xSize, ySize, provider.extent(), provider.crs())

    #remove the intersection layer from the canvas
    QgsMapLayerRegistry.instance().removeMapLayers( [intersectionLayer.id()] )

    else:
    print "layer type not supported"

    #Now that all the intersections have been calculated remove the new square
    print "Removing temporary grid item " + str(i) + "(" + newSquareLayer.id() + ")"
    QgsMapLayerRegistry.instance().removeMapLayers( [newSquareLayer.id()] )

    #Remove the grid
    QgsMapLayerRegistry.instance().removeMapLayers( [gridLayer.id()] )
    To use this script:
    • Open the Python console:
    1. Open the editor and copy&paste the script there
    2. Save the script
    3. Execute it

    Could take a couple of minutes for large files, particularly the raster ones, but at least it's automatic.


    Update (11/12/2014)

    Although the above script worked as planned, the import process didn't, particularly on the data between the generated tiles. As there's no overlap on the clipped data, after processing small gaps would appear on the end-result. Thus, I've created a brand new implementation that is a little bit more polished and supports a new "buffer" parameter. This allows the tiles to overlap slightly like:
    Also, the grid is now created programmatically without using "creategrid" function, which also allowed me to use a more logical X,Y naming for the tiles.

    The new code is:
    import processing
    import os

    ####### PARAMS #######

    originX = -180
    originY = 90

    stepX = 10
    stepY = 10

    width = 360
    height = 180

    iterationsX = width / stepX
    iterationsY = height / stepY

    buffer = 1

    j = 0
    i = 0

    targetBaseFolder = "C:\\temp\\grid"

    ####### MAIN #######

    for i in xrange(0,iterationsX):

    for j in xrange(0,iterationsY):

    tileId = str(i) + "_" + str(j)

    folder = targetBaseFolder + "\\" + tileId

    if not os.path.exists(folder):
    os.makedirs(folder)

    print "Processing tile " + tileId

    minX = (originX + i * stepX) - buffer
    maxY = (originY - j * stepY) + buffer
    maxX = (minX + stepX) + buffer
    minY = (maxY - stepY) - buffer

    wkt = "POLYGON ((" + str(minX) + "" + str(maxY)+ ", " + str(maxX) + "" + str(maxY) + ", " + str(maxX) + "" + str(minY) + ", " + str(minX) + "" + str(minY) + ", " + str(minX) + "" + str(maxY) + "))"

    tileLayer = iface.addVectorLayer("Polygon?crs=epsg:4326", "tile", "memory")
    provider = tileLayer.dataProvider()
    tileFeature = QgsFeature()

    tileFeature.setGeometry(QgsGeometry.fromWkt(wkt))
    provider.addFeatures( [ tileFeature ] )

    for mapLayer in iface.mapCanvas().layers():

    layerType = mapLayer.type()
    layerName = mapLayer.name()
    intersectionName = "intersection_" + layerName + "_" + tileId

    #vector layers and raster layers are processed differently
    if layerType == QgsMapLayer.VectorLayer and layerName != "tile":

    #Calculate the intersection between the specific grid rectangle and the layer
    intersection = processing.runalg("qgis:intersection", mapLayer, tileLayer, None)

    iface.addVectorLayer(intersection.get("OUTPUT"),intersectionName,"ogr")

    #create a shapefile for this new intersection layer on the filesystem.
    #A separate folder will be added for each square
    intersectionLayer = QgsMapLayerRegistry.instance().mapLayersByName(intersectionName)[0]
    QgsVectorFileWriter.writeAsVectorFormat(
    intersectionLayer,
    folder + "\\" + layerName + ".shp",
    "utf-8", QgsCoordinateReferenceSystem(4326),
    "ESRI Shapefile")

    #remove the intersection layer from the canvas
    QgsMapLayerRegistry.instance().removeMapLayers( [intersectionLayer.id()] )

    elif layerType == QgsMapLayer.RasterLayer:

    #Calculate the intersection between the specific grid rectangle and the raster layer
    intersection = processing.runalg('saga:clipgridwithpolygon', mapLayer, tileLayer, None)

    #add the intersection to the map
    iface.addRasterLayer(intersection.get("OUTPUT"), intersectionName)

    #export to file
    intersectionLayer = QgsMapLayerRegistry.instance().mapLayersByName(intersectionName)[0]

    pipe = QgsRasterPipe()
    provider = intersectionLayer.dataProvider()
    pipe.set(provider.clone())

    rasterWriter = QgsRasterFileWriter(folder + "\\" + layerName + ".tif")
    xSize = provider.xSize()
    ySize = provider.ySize()

    rasterWriter.writeRaster(pipe, xSize, ySize, provider.extent(), provider.crs())

    #remove the intersection layer from the canvas
    QgsMapLayerRegistry.instance().removeMapLayers( [intersectionLayer.id()] )

    else:
    print "layer type not supported"

    #remove the temporary tile
    QgsMapLayerRegistry.instance().removeMapLayers( [tileLayer.id()] )


    Eventually I'll create a proper QGIS plugin for this that allows setting input parameters without all that hardcoded logic.

      Processing GeoTiff files in .NET (without using GDAL)

      $
      0
      0
      I've recently created a process that is able to import geoferenced raster data, namely GeoTiff files... with a catch:
      As I didn't find a proper lib to load GeoTiff files I was converting the source files to an ASCII Gridded XYZ format prior to importing. Despite the fancy name it's simply an ASCII file where each line contains:
      <LONGITUDE>     <LATITUDE>      <VALUE1>   [ <VALUE 2>]   [<VALUE 3>]
      Each line on this file corresponds to a pixel on a raster image, thus it's incredibly easy to parse in C#. The code would be something like this:
      foreach (var line in File.ReadLines(filePath))
      {
      if (line == null)
      {
      continue;
      }

      var components = line.Split(
      new[] { '' },
      StringSplitOptions.RemoveEmptyEntries);

      var longitude = double.Parse(components[0]);
      var latitude = double.Parse(components[1]);

      IEnumerable<string> values = components.Skip(2);

      //... process each data item

      yield return dataItem;
      }

      Nice and easy. But this has two disadvantages:

      First, it requires an extra step to convert to XYZ from Geotiff, although easily done with the GDAL:
      gdal_translate -of XYZ <input.tif> <output.xyz>
      Another disadvantage is that the XYZ becomes much larger than its TIFF counterpart. Depending on the source file the difference could be something like 10 GB vs 500 MB (yes, 50x bigger)

      So, I would really like to be able to process a GeoTiff file directly in c#. One obvious candidate is using GDAL, particularly its C# bindings. Although these bindings work relatively well they rely on an unmanaged GDAL installation. For me this is a problem as I want to host this on Azure WebSites, where installing stuff is not an option.
      So, I embraced the challenge of being able to process a GeoTIFF file in a fully managed way.


      The file that I'll be loading is this one. It's an height map for the entire world (21600x10800, 222MB)


      First step, loading the TIFF file, still ignoring any geo data.

      Fortunately I found a really nice lib that does exactly what I wanted: be able to load a tiff file in c#, fully managed. It's called LibTiff.NET.

      Although I'm not really found of its API, it does include tons of functionality and documentation. Most demos load the full image into memory (which isn't really viable for larger tiff files) but it does include the capability to process a file one line at a time.

      My starting point was this example here. The important bits are:
      using (Tiff tiff = Tiff.Open(@"<file.tif>", "r"))
      {
      int width = tiff.GetField(TiffTag.IMAGEWIDTH)[0].ToInt();
      byte[] scanline = new byte[tiff.ScanlineSize()];

      for (int i = 0; i < height; i++)
      {
      tiff.ReadScanline(scanline, i);
      }
      }
      This sample opens a tiff and iterates each line. This code is used to open 8bit tiff files. 16 bits files would require an additional operation:
      using (Tiff tiff = Tiff.Open(@"<file.tif>", "r"))
      {
      int width = tiff.GetField(TiffTag.IMAGEWIDTH)[0].ToInt();
      byte[] scanline = new byte[tiff.ScanlineSize()];
      ushort[] scanline16Bit = new ushort[tiff.ScanlineSize() / 2];

      for (int i = 0; i < height; i++)
      {
      tiff.ReadScanline(scanline, i);
      Buffer.BlockCopy(scanline, 0, scanline16Bit, 0, scanline.Length);
      }
      }
      Second step, loading geographical data and corresponding height value

      The aforementioned lib doesn't include any support for GeoTiff. So, time to take a look at the official docs.

      According to the official FAQ (http://www.remotesensing.org/geotiff/faq.html):
      GeoTIFF is a metadata format, which provides geographic information to associate with the image data. But the TIFF file structure allows both the metadata and the image data to be encoded into the same file.
      GeoTIFF makes use of a public tag structure which is platform interoperable between any and all GeoTIFF-savvy readers. Any GIS, CAD, Image Processing, Desktop Mapping and any other types of systems using geographic images can read any GeoTIFF files created on any system to the GeoTIFF specification.
       
      Before delving into the spec, I need a comparison point to make sure I'm getting the proper values. Thus I'm using gdalinfo to provide some information on the raster file. It's usage is really simple:
      gdalinfo altitude.tif
      This outputs the following information:
      Size is 21600, 10800
      Coordinate System is:
      GEOGCS["WGS 84",
      DATUM["WGS_1984",
      SPHEROID["WGS 84",6378137,298.257223563,
      AUTHORITY["EPSG","7030"]],
      AUTHORITY["EPSG","6326"]],
      PRIMEM["Greenwich",0],
      UNIT["degree",0.0174532925199433],
      AUTHORITY["EPSG","4326"]]
      Origin = (-180.000000000000000,90.000000000000000)
      Pixel Size = (0.016666666666667,-0.016666666666667)
      Metadata:
      AREA_OR_POINT=Area
      EXIF_ColorSpace=65535
      EXIF_DateTime=2005:10:12 22:04:52
      EXIF_Orientation=1
      EXIF_PixelXDimension=21600
      EXIF_PixelYDimension=10800
      EXIF_ResolutionUnit=2
      EXIF_Software=Adobe Photoshop CS2 Macintosh
      EXIF_XResolution=(72)
      EXIF_YResolution=(72)
      Image Structure Metadata:
      INTERLEAVE=BAND
      Corner Coordinates:
      Upper Left (-180.0000000, 90.0000000) (180d 0' 0.00"W, 90d 0' 0.00"N)
      Lower Left (-180.0000000, -90.0000000) (180d 0' 0.00"W, 90d 0' 0.00"S)
      Upper Right ( 180.0000000, 90.0000000) (180d 0' 0.00"E, 90d 0' 0.00"N)
      Lower Right ( 180.0000000, -90.0000000) (180d 0' 0.00"E, 90d 0' 0.00"S)
      Center ( 0.0000000, 0.0000000) ( 0d 0' 0.01"E, 0d 0' 0.01"N)
      Band 1 Block=21600x1 Type=Byte, ColorInterp=Gray
      Min=0.000 Max=213.000
      Minimum=0.000, Maximum=213.000, Mean=22.754, StdDev=25.124
      Metadata:
      STATISTICS_MAXIMUM=213
      STATISTICS_MEAN=22.753594797178
      STATISTICS_MINIMUM=0
      STATISTICS_STDDEV=25.124203131182

      I'm mostly interested on these two lines:
      Origin = (-180.000000000000000,90.000000000000000)
      Pixel Size = (0.016666666666667,-0.016666666666667)
      This means that the top-left corner of the image corresponds to coordinate -180,90 and that each pixel increments 0.016(7) degrees.

      So, time to check the spec, namely section 2.6.1 on http://www.remotesensing.org/geotiff/spec/geotiff2.6.html):

      Apparently tags 33922 and 33550 provide exactly the information I need. They're defined as:
      ModelTiepointTag:
            Tag = 33922 (8482.H)
            Type = DOUBLE (IEEE Double precision)
            N = 6*K,  K = number of tiepoints
            Alias: GeoreferenceTag
            Owner: Intergraph
      This tag stores raster->model tiepoint pairs in the order

              ModelTiepointTag = (...,I,J,K, X,Y,Z...),
      where (I,J,K) is the point at location (I,J) in raster space with pixel-value K, and (X,Y,Z) is a vector in model space. In most cases the model space is only two-dimensional, in which case both K and Z should be set to zero; this third dimension is provided in anticipation of future support for 3D digital elevation models and vertical coordinate systems.
      and
      ModelPixelScaleTag:
            Tag = 33550
            Type = DOUBLE (IEEE Double precision)
            N = 3
            Owner: SoftDesk
      This tag may be used to specify the size of raster pixel spacing in the model space units, when the raster space can be embedded in the model space coordinate system without rotation, and consists of the following 3 values:

          ModelPixelScaleTag = (ScaleX, ScaleY, ScaleZ)
      where ScaleX and ScaleY give the horizontal and vertical spacing of raster pixels. The ScaleZ is primarily used to map the pixel value of a digital elevation model into the correct Z-scale, and so for most other purposes this value should be zero (since most model spaces are 2-D, with Z=0).
      To read theses tags with the LibTiff.Net lib one needs to use the GetField method. Thus, loading the values from these tags will be as simple as:
      FieldValue[] modelPixelScaleTag = tiff.GetField((TiffTag)33550);
      FieldValue[] modelTiepointTag = tiff.GetField((TiffTag)33922);

      byte[] modelPixelScale = modelPixelScaleTag[1].GetBytes();
      double pixelSizeX = BitConverter.ToDouble(modelPixelScale, 0);
      double pixelSizeY = BitConverter.ToDouble(modelPixelScale, 8)*-1;

      byte[] modelTransformation = modelTiepointTag[1].GetBytes();
      double originLon = BitConverter.ToDouble(modelTransformation, 24);
      double originLat = BitConverter.ToDouble(modelTransformation, 32);
      With this information I'm mostly ready to iterate the various raster lines. But, and although conceptually the top-left corner corresponds to coordinate -180, 90 the top-left pixel itself corresponds to coordinate -179.99166, 89.99166. This is obtained through:
      double startLat = originLat + (pixelSizeY/2.0);
      double startLon = originLon + (pixelSizeX/2.0);

      So here's the full source-code.
      Disclaimer: This is mostly coded for my particular scenario as GeoTiff supports a wider-range of options.
      using (Tiff tiff = Tiff.Open(filePath, "r"))
      {
      int height = tiff.GetField(TiffTag.IMAGELENGTH)[0].ToInt();
      FieldValue[] modelPixelScaleTag = tiff.GetField((TiffTag)33550);
      FieldValue[] modelTiepointTag = tiff.GetField((TiffTag)33922);

      byte[] modelPixelScale = modelPixelScaleTag[1].GetBytes();
      double pixelSizeX = BitConverter.ToDouble(modelPixelScale, 0);
      double pixelSizeY = BitConverter.ToDouble(modelPixelScale, 8)*-1;

      byte[] modelTransformation = modelTiepointTag[1].GetBytes();
      double originLon = BitConverter.ToDouble(modelTransformation, 24);
      double originLat = BitConverter.ToDouble(modelTransformation, 32);

      double startLat = originLat + (pixelSizeY/2.0);
      double startLon = originLon + (pixelSizeX / 2.0);

      var scanline = new byte[tiff.ScanlineSize()];

      //TODO: Check if band is stored in 1 byte or 2 bytes.
      //If 2, the following code would be required
      //var scanline16Bit = new ushort[tiff.ScanlineSize() / 2];
      //Buffer.BlockCopy(scanline, 0, scanline16Bit, 0, scanline.Length);

      double currentLat = startLat;
      double currentLon = startLon;

      for (int i = 0; i < height; i++)
      {
      tiff.ReadScanline(scanline, i); //Loading ith Line

      var latitude = currentLat + (pixelSizeY * i);
      for (var j = 0; j < scanline.Length; j++)
      {
      var longitude = currentLon + (pixelSizeX*j);
      geodata.Points[0] = new[] { new PointXY(longitude, latitude) };
      object value = scanline[j];

      //... process each data item

      yield return dataItem;
      }
      }
      }
      This code is actually working quite well. Eventually could be interesting to put this onto a proper lib and add support for additional GeoTiff features. Adding that to my backlog :)

      Game-development Log (12. Scaling up the loader process)

      $
      0
      0

      During the last month I've been mostly refactoring the loader process. As it was I had lots of trouble loading larger areas. I've detailed the problem (and the solution) on a previous post. I've also optimized the loading process and I'm able to load the whole world in about 1 day, already including pre-generating the lower zoom level images.

      Regardless, I've haven't yet imported the whole world as everything is still work in progress. I'm planning to add some additional stuff to the map, like mountains, regions, cities and overall improved aesthetics.

      I've currently imported to Azure a rectangle that goes from coordinate [15E 60N] to [15W 30N]. Basically this area:


      If you zoom in inside this area the Bing Maps tiles are replaced with my own (after zoom level 7). For example, zooming in into London:


      Or a random area on Norway:

      Or Béchar in Algeria:

      The most important thing to note is that those hexagons are not simply cosmetic. All information is being pushed to client-side so that the units will behave differently depending on the terrain. For example, a tank can only cross a river through a bridge:


      I've also added:
      Deserts
      Two levels of forests: dense and sparse

      Anyway, you can play around with it at: https://site-win.azurewebsites.net/


      Displaying WebGL on Bing Maps (using Pixi.js)

      $
      0
      0
      Something that has been on my backlog for some time is trying to mix Bing Maps and WebGL, similarly to what I've done for an "old" Google Maps experiment.

      That previous demo was done on top of a Google maps sample, hence just requiring some small tweaks and improvements. Also, was very low-level and not really practical to adapt to more "real-world" usage, as it required programming the shaders, computing the transformation matrixes, etc.
      Thus, I was trying to find a alternative WebGL JS lib that was:
      • Fast
      • Easy to use, albeit still providing some low-level control, namely on primitives drawing
      After some research I ended up with two candidates:
      IvanK Lib is pretty good (and fast) but Pixi.js takes the cake with tons of functionality and a large community using it.

      I'm going to enumerate the various experiments I did, showing a sample page for each.


      Recommendation: use Chrome as otherwise it might be painfully slow/non-working.

      1.  Create a pixi stage on top of Bing Maps.
      http://psousa.net/demos/bingmaps/webgl/pixi/pixi1.html
      var mapDiv = map.getRootElement();
      stage = new PIXI.Stage();

      // create a renderer instance mapping (pun intended) the size of the map.
      renderer = PIXI.autoDetectRenderer(
      map.getWidth(),
      map.getHeight(),
      {transparent: true});

      // add the renderer view element to the DOM, making it sit on top of the map
      mapDiv.parentNode.lastChild.appendChild(renderer.view);

      renderer.view.style.position = "absolute";
      renderer.view.style.top = "0px";
      renderer.view.style.left = "0px";

      renderer.render(stage);


      Yep, nothing visible. Regardless, if you open a DOM inspector you can see a canvas element that was generated on top of the map.


      2. Add a sprite to the map.
      http://psousa.net/demos/bingmaps/webgl/pixi/pixi2.html
      var texture = PIXI.Texture.fromImage("img/bunny.png");
      var bunny = new PIXI.Sprite(texture);

      // center the sprite anchor point
      bunny.anchor.x = 0.5;
      bunny.anchor.y = 0.5;

      bunny.lat = 40.0;
      bunny.lon = -8.5;

      var pixelCoordinate = map.tryLocationToPixel(
      new MM.Location(bunny.lat, bunny.lon),
      MM.PixelReference.control);

      bunny.position.x = pixelCoordinate.x;
      bunny.position.y = pixelCoordinate.y;

      stage.addChild(bunny);
      Although the bunny is properly added on top of the map it's not georeferenced. Thus, if the map is moved the bunny stays on the same screen position.


      3. Listen to the viewchange event and update the sprite position
      http://psousa.net/demos/bingmaps/webgl/pixi/pixi3.html
      MM.Events.addHandler(map, 'viewchange', updatePosition);
      (...)

      function updatePosition(e) {
      var pixelCoordinate = map.tryLocationToPixel(
      new MM.Location(bunny.lat, bunny.lon),
      MM.PixelReference.control);

      bunny.position.x = pixelCoordinate.x;
      bunny.position.y = pixelCoordinate.y;
      renderer.render(stage);
      }
      4. Do the same thing for 1000 sprites
      http://psousa.net/demos/bingmaps/webgl/pixi/pixi4.html
      Depending on your machine (and graphics card) should still behave nicely. Regardless, when displaying lots of similar sprites pixi.js supports the concept of SpriteBatch:
      The SpriteBatch class is a really fast version of the DisplayObjectContainer built solely for speed, so use when you need a lot of sprites or particles
      5. Use SpriteBatch
      http://psousa.net/demos/bingmaps/webgl/pixi/pixi5.html
      container = new PIXI.SpriteBatch();
      stage.addChild(container);

      for (var i = 0; i < 1000; i++) {
      var bunny = new PIXI.Sprite(texture);

      // center the sprites anchor point
      bunny.anchor.x = 0.5;
      bunny.anchor.y = 0.5;

      // move the sprite t the center of the screen

      bunny.lat = 40.0 + Math.random() * 20;
      bunny.lon = -8.5 + Math.random() * 50;

      var pixelCoordinate = map.tryLocationToPixel(
      new MM.Location(bunny.lat, bunny.lon),
      MM.PixelReference.control);

      bunny.position.x = pixelCoordinate.x;
      bunny.position.y = pixelCoordinate.y;

      container.addChild(bunny);

      bunnies.push(bunny);
      }
      It's really simple to use. Instead of adding the sprites to the stage add them to a SpriteBatch. Now, the problem is that this code is still updating the position of each individual sprite when moving/zooming the map.

      6. Scale the SpriteBatch instead of reposition individual sprites
      http://psousa.net/demos/bingmaps/webgl/pixi/pixi6.html
      function updatePosition(e) {
      if(!e.linear) //zooming animation
      {
      var currentWidth = getCurrentWidth();
      var diff = startWidth / currentWidth;

      container.scale.x = diff;
      container.scale.y = diff;

      var divTopLeft = map.tryLocationToPixel(startPosition, MM.PixelReference.control);

      var x = divTopLeft.x;
      var y = divTopLeft.y;

      container.position.x = x;
      container.position.y = y;

      renderer.render(stage);
      }
      }
      This sample doesn't update the individual sprites and scales the SpriteBatch as a whole. This provides a good performance impact, although the sprites will look pixelated on higher zoom levels.
      An improved solution would be to use this mechanism on panning/zooming, and having different LOD (Level-of-Detail) Sprites, which would be redrawn when the zoom animation finished.

      Now, instead of drawing sprites I'm going to show how to draw primitives (in this case rectangles).

      7. Draw primitives
      http://psousa.net/demos/bingmaps/webgl/pixi/pixi7.html

      graphics = new PIXI.Graphics();
      var referencePixel = map.tryLocationToPixel({ latitude: 44, longitude: -9.5}, MM.PixelReference.control);

      graphics.beginFill(0xFFFFFF);
      for(var i=0; i < 20000; i++) {
      graphics.drawRect(referencePixel.x + Math.random()* 1200.0, referencePixel.y + Math.random()*900.0, 2, 2);
      }
      graphics.endFill();
      I'm basically creating 20000 small rectangles using pixi.js. On higher zoom levels precision isn't lost as this is vector data (as opposed to the raster data from the previous examples).

      All of this is obviously non-production code with various bugs. Regardless, future looks promising :)

      Displaying 3d objects on Bing Maps (using Three.js)

      $
      0
      0
      On my previous post I've made a couple of experiments on displaying 2d content on top of Bing Maps using Pixi. Performance was top-notch, particularly if the browser supported WebGL (fallbacking to Canvas otherwise).

      This time I'm trying to take the WebGL experiment even further by adding 3d content on top of a map. For that I'm going to use the most popular WebGL 3D lib out there: Three.js

      Let me start by showing the end-result.


      I've placed some boxes on top of a map. Although the map by itself is 2D the boxes are rendered in 3D using WebGL. Thus, as further away from the screen center (the vanishing point) the more pronounced the depth effect will be.
      So, how to do this on top of Bing Maps?

      As usual, I've decomposed this into simpler steps.

      1. Create a DOM element on top of Bing maps to place the Three.JS renderer

      This code is very similar to its Pixi counterpart (from my previous post).
      var mapDiv = map.getRootElement();
      var width = map.getWidth();
      var height = map.getHeight();

      renderer = new THREE.WebGLRenderer( { alpha: true } );
      renderer.shadowMapEnabled = true;
      renderer.setSize(width, height);
      mapDiv.parentNode.lastChild.appendChild( renderer.domElement );

      renderer.domElement.style.position = "absolute";
      renderer.domElement.style.top = "0px";
      renderer.domElement.style.left = "0px";
      The renderer should be created with "alpha", otherwise the map won't be visible.

      With this code a canvas element is generated on top of the map for the renderer.


      2. Add boxes, lights and a camera

      Nothing really special there. Just added these objects directly without any "spatial" positioning. Used:
      • THREE.PerspectiveCamera for the camera
      • THREE.BoxGeometry for the boxes
      • THREE.AmbientLight/THREE.PointLight for the lights
      • A simple texture for the boxes

      3. Mapping boxes position to geo coordinates

      Now this was the tricky part. All the magic is done on function "updatePosition". What I do, per box, is:
      • Obtain the geo-coordinate associated with the box
      • Obtain the screen coordinate for that coordinate
        • Using map.tryLocationToPixel
      • Obtain the Three.js world coordinates for that pixel
        • Uses a technique called raycasting, trying to find the interception between a projected ray from the obtained screen coordinate to an invisible plane object that I've created.
        • The interception will be the world coordinate to where the box needs to be moved.
      • As the pivot point of the box is on its center the box needs to be shifted upwards to half of its height (I'm actually doing this just once during the loading phase)
      • During zoom the box needs to be scaled. I've added a parent object for each box (at the bottom) to work out as a new pivot point.
      Anyway, here's a video of this experiment in action

      And also a working page: http://psousa.net/demos/bingmaps/webgl/three/three3.html where you can take a look at the code. Just remember to open this using Chrome :)

      So this is basically it. I believe it has the potential for some interesting use cases and WebGL is here to stay. More and more people are using compatible browsers and Microsoft decision to simplify upgrading to Windows 10 will certainly bump this number even further.

      Game-development Log (13. Polishing the experience)

      $
      0
      0

      Although I haven't been really active on my blog I've been playing a lot with this project adding tons of new stuff. I'm going to detail the various elements that I've updated/implemented during the last month:
      • Pre-Generating additional Zoom Level images
      • Representing Altitude
      • Unit Energy
      • Unit Direction
      • Unit LOD Icons
      • Infantry Unit Type
      • Movement Restriction
      • Coordinate display on higher zoom levels
      Pre-Generating additional Zoom Level images

      Currently my map-tiles are always generated in server-side. Some of these tiles, from zoom level 7 to 10, are pre-generated and stored on Azure's blob storage.

      Zoom Level 7 (static)
      Zoom Level 10 (static)


      The additional zoom levels, from 11 to 13, are generated dynamically through a tile service.
      Zoom Level 12 (dynamic)
      Although this works it's not really cost-effective, as it would require new machines to be spawned to handle the additional load of having additional users interact with the tile-service for the closer zoom levels.

      So, two additional options here:
      • Draw the map-tiles in client-side (WebGL/Canvas), having the clients fetch the vector data.
      • Pre-generate the other zoom levels
      Regarding the WebGL approach, I did spend some time making a couple of experiments (resulting on some of my last posts), but in the end I wasn't fully satisfied with the approach, nor its performance (although I might pick up on this latter on).

      I've decided to keep the server-side approach I've been using so far, but pre-generating more zoom levels. But, in order to do so, I had to improve my loader tool, including tons of changes/refactors and segregating the image generation process so that I can, for instance, use Azure Web Jobs to offload the image-tile generation.

      Currently, on my laptop, it takes around 15 minutes to generate an area such as the United Kingdom. Not incredibly fast but completely parallelizable and I'm able to load separate areas simultaneously.

      Currently on Azure I've imported the following region:

      I'll soon import the rest of the world.

      Representing Altitude

      I was already representing the altitude on the land hexagons. Thus, according to their height, the hexagons would be slightly brightened.
      A couple of areas with a lighter green, representing some hills (old version)
      I've kept that cosmetic subtle effect but added a whole new thing that also affects gameplay: slopes. Thus, I detect if there's any altitude change between two hexagons and if so, I create a slope. The end-result is something like this:
      The effect is now much less subtle (new version)
      This will impact movement (already does for tanks) and line-of-sight (planned).

      Multiple levels can also be stacked. In this image I have 6 different height levels:


      Unit Energy

      I've added the concept of energy to the units. This includes a typical visual representation with a green bar that turns to yellow and finally to red when there's just a little bit of energy left.

      Currently units may attack other units, removing their energy, without any restriction on friendly fire whatsoever. When the unit reaches zero energy it's removed.

      Unit Direction

      Previously the icon was always facing north, regardless of the direction they had moved. Now the icon is updated to reflect the last movement it did.

      Unit LOD icons

      The engine now supports representing different Level-of-Detail (LOD) icons for the units according to the zoom level. Currently I've only setup 2 levels but could use additional levels if required. This transition is also used to represent the zoom level on which interaction is not longer possible.


      Infantry Unit Type

      I've also added a new unit type: infantry. It doesn't have any terrain restriction and can only move one hexagon at a time.


      Unit Movement Restriction for tanks

      I've added a couple of movement restrictions for the tanks and now they can't:
      - Enter forests
      - Climb slopes (except using a road)


      Coordinate display on higher zoom levels

      The maximum zoom level (13) now displays the U,V coordinates for the hexagons. This could eventually have a great strategic value, particularly for team-play. Will allow stuff like: "rally with me at 8310 788" or "enemy spotted at 8719 667", etc.

      Also, it's quite useful for debugging/development purposes :)

      Anyway, you can see this work-in-progress live at: https://site-win.azurewebsites.net

      Next steps:
      • Generate tiles for the rest of the world
      • Cool-down time after moving/attacking
      • Line-of-sight
      • Unit visibility (ex: an infantry unit inside an hexagon forest will be hidden from other players)

      Improve tile-loading at the browser

      $
      0
      0
      Slippy Map, such as Bing Maps or Google Maps, is composed of multiple tiles. Each tile, typically a 256x256 image, is individually fetched from the server.

      As displays are now supporting incredibly high resolutions, this means that tons of server requests will be required to fill a single map view. For example, on my laptop with retina display, opening a single full screen map will result in about 48 individual tiles being requested simultaneously.

      This is a problem as by default web browsers will limit the number of active connections for each domain. This value varies per browser, but we're talking about an average of 6 concurrent downloads per domain, which is quite low. So, assuming all tiles are served from the same domain, lots of throttling will occur.

      So, how to cope with this?

      1. Tile Size

      If you control the tile generation process a "simple" option will be to generate bigger tiles, hence reducing the number of requests. Bing Maps, for instance, supports setting different sizes for the tiles (reference).

      For example, setting the tile size to be 512 instead of 256:

      var MM = Microsoft.Maps;
      var map = new MM.Map(document.getElementById("mapDiv"), {
      center: new MM.Location(45.0, 10),
      zoom: 5,
      credentials:"your key here"});

      var tileSource = new MM.TileSource({
      width: 512,
      height: 512,
      uriConstructor: function(tile) {
      return "images/square512.png";
      }});

      var tileLayer = new MM.TileLayer({ mercator: tileSource});
      map.entities.push(tileLayer);
      In this particular case we're talking about 15 tiles being requested (albeit each one being bigger), which is a big difference from the previous 48.

      2. Serve tiles from different urls

      A technique called domain sharding can be also be used, on which different domains are used to fetch the same information, thus bypassing the "same-domain" browser limitation.

      A good example of this can be seed on Bing Maps, as it's using this technique to speed up serving the tiles.

      Taking a look at the web-traffic for the base tiles we can see 4 different hostnames being used:

      • https://t0.ssl.ak.dynamic.tiles.virtualearth.net
      • https://t1.ssl.ak.dynamic.tiles.virtualearth.net
      • https://t2.ssl.ak.dynamic.tiles.virtualearth.net
      • https://t3.ssl.ak.dynamic.tiles.virtualearth.net

      The corresponding hostname is determined by the last digit of the quadkey that identifies the tile. For example, tile 0331 will use t1, tile 0330 will use t0, and so on.

      Using Genetic Algorithms to solve the Traveling Salesman Problem on Bing Maps

      $
      0
      0
      A couple of years ago I was really into Genetic Algorithms and Ant Colony Systems, mostly focusing on solving known NP-Complex problems such as the TRP (Traveling Salesman Problem) and the VRP (Vehicle Routing Problem).

      As I have a couple of interesting use-cases that could benefit from these types of algorithms what better way to refresh my knowledge than making a simple mapping experiment solving the TRP problem?

      Here's a short summary of these concepts:
      • TRP - Optimization problem that tries to find the shortest route that passes on all supplied points
      • Genetic Algorithm
        • There's a population were each element represents a solution to the problem
        • The algorithm progresses through various iterations, called generations
        • On each generation the various elements of the population mate and create new elements
        • The fittest elements survive and the weakest die
      It obviously has much more going on than that, including stuff like roulette selection, mutation, elitism, etc.

      I'll create a map where the user can input waypoints and the algorithm will find the shortest path.

      1. Creating the problem space

      I'll simply add a map on which the user can click to add new points. Clicking on an existing point removes it.


      Now, drawing a path for the points. This polyline will represent the route to be optimized.

      I've actually changed the default pushpin to have one with a centered anchor point

      Now I just need the algorithm :)

      2. Creating the optimization algorithm

      Regarding genetic algorithms, and although conceptually they might look sophisticated and complex, in reality they're incredibly simple. Actually, most of the algorithms based on real-life models (like ant-colonies, genetic, simulated annealing) are very easy to grasp and implement.

      Regardless, various JS libraries already exist and instead of reinventing the wheel I've chosen one called "genetic-js". I've never used it before but it does look really cool: clean API, good documentation and a nice set of features.

      I'll need to implement:
      • a seed function:
      Used to generate the various individuals of the population. In this particular case each element will include all the waypoints on a random order.
      • a fitness function:
      Measures the fitness of an individual. Will represent the total distance of a route, hence the smaller the better. The distance will be, for now, linear, not taking into consideration the driving route. I'm using Vincenty's formulae for the distance calculation.
      • a crossover function:
      This function represents how two children are generated after two individuals have mated. I'm just going to make a dumb crossover function that just picks a random segment from a parent and mixes it with the other parent. As a side-note this is typically where the algorithm is optimized by using smarter mating strategies instead of just relying on chance. These are called "greedy" implementations vs "pure" ones.
      • a mutation function:
      There's a small probability of an individual simply mutating. This function represents how that will happen. I'm going to do a basic mutation function that just swaps random points of the route. Similarly to the crossover function, the mutation function also benefits a lot from greedy approaches. Anyway, not really the scope of this post to create an optimized algorithm so the random version will do.

      Also, some additional parameters should be set, mostly around probabilities, selection logic for mating, etc.

      To trigger the process I've added a simple button and a couple of labels to update the progress.
      Now, testing the sucker:

      Initial setup with 20 points

      During the Execution

      Final Route found
      The current algorithm typically takes a lot of iterations (generations) to reach good solutions. There are very detailed studies on proper crossover and mutation functions to achieve good TSP results. Eventually I might update this sample to improve the algorithm, but for now you can test this live as-is at: http://psousa.net/demos/bingmaps/trp/

      Game-development Log (14. CDN Improvements)

      $
      0
      0

      I haven't been really active on the development of this project as I've been occupied with other stuff. Regardless, I'm now focused on returning to active development on it.

      Interestingly enough what actually triggered my return was a couple of Azure announcements last week on the CDN front. First, some context:

      Although I like Azure quite a lot its CDN offering has been quite lacking to say the least. The community was quite vocal in requesting some essential features but Microsoft neglected to provide any updates or expected delivery dates, as seen here: http://feedback.azure.com/forums/169397-cdn

      For example, the top voted feature request was the ability to force content to be refreshed, which is, IMHO, completely essential for a CDN offering:

      http://feedback.azure.com/forums/169397-cdn/suggestions/556307-ability-to-force-the-cdn-to-refresh-any-cached-con

      The feature was requested 5 years ago, eventually marked as "planned", and no further update was provided by Microsoft, similarly to the other requested features.

      Well, all of this until last week, when Microsoft apparently woke up.

      First they've provided feedback on most of the feature requests and provided an expectation around release dates. Not ideal (as most of these features are late by a few years) but positive nevertheless.

      Then, the icing on the top of the cake was this post:

      https://azure.microsoft.com/blog/2015/06/04/announcing-custom-origin-support-for-azure-cdn/

      Basically Microsoft shipped three awesome features for the CDN:

      I'll just copy&paste from that post:
      Custom Origins Supported
      Azure CDN can now be used with any origin. Previously, Azure CDN only supported a limited set of Azure Services (i.e. Web Apps, Storage, Cloud Services and Media Services) and you only had the ability to create a CDN endpoint for an Azure Service that was in your Azure Subscription. With this recent update, you can now create a CDN endpoint for any origin you like. This includes the ability to create an origin in your own data center, an origin provided by third party cloud providers, etc. and gives you the flexibility to use any origin you like with Azure CDN!
      Multiple CDN Endpoints with the Same Origin
      Several of you may have tried to create multiple CDN endpoints for the same origin and found this wasn’t possible due to restrictions. We have now removed the restrictions and you now have the ability to create multiple endpoints for the same origin URL. This provides you a more refined control over content management and can be used to improve performance as multiple host names can be used to access assets from the same origin.
      Save Content in any Origin Folder
      Previously, when you created a CDN endpoint for cloud services you were required to use “/cdn/” as the default origin path. For example, if the path for your cloud service washttp://strasbourg.cloudapp.net you were required to use http://strasbourg.cloudapp.net/cdn/ as the root path to get content from your origin when you created a CDN endpoint. This restriction has been removed and you can store content in any folder. Using the previous example, you can now use http://strasbourg.cloudapp.net/as the root path to get content from your origin.
      These might seem minor changes but let me explain how they positively affect this project:


      Multiple CDN Endpoints with the Same Origin

      Completely related with my blog-post on improving tile-loading at the browser (http://build-failed.blogspot.pt/2015/03/improve-tile-loading-at-browser.html), a really simple performance improvement relies on having multiple urls for the map-tiles.

      This technique is called domain sharding. Different domains are used to fetch the same information, thus bypassing the "same-domain" browser limitation. This limitation is implemented differently on the various browsers, but all include a hard-limit on the number of requests that can be done concurrently to the same url. With this approach I'm basically quadrupling this number.

      I've created 4 different CDN urls:

      • http://az710822.vo.msecnd.net/imagetiles/{quadkey}.jpg 
      • http://az768596.vo.msecnd.net/imagetiles/{quadkey}.jpg
      • http://az769152.vo.msecnd.net/imagetiles/{quadkey}.jpg
      • http://az769848.vo.msecnd.net/imagetiles/{quadkey}.jpg

      All of them are pointing to the same blob storage containg all the tiles. The difference is that, on client-side, the url used to request each tile is dependent on the last digit of the quadkey that identifies the tile.

      Thus:
      • http://az710822.vo.msecnd.net/imagetiles/{quadkey}.jpg   (quadkeys ending in 0)
      • http://az768596.vo.msecnd.net/imagetiles/{quadkey}.jpg   (quadkeys ending in 1)
      • http://az769152.vo.msecnd.net/imagetiles/{quadkey}.jpg   (quadkeys ending in 2)
      • http://az769848.vo.msecnd.net/imagetiles/{quadkey}.jpg   (quadkeys ending in 3)
      Example:


      Notice the different urls for each tile.

      The interesting part is that, cost-wise, this approach doesn't affect my Azure bill as the set of cached tiles for each CDN has no duplicates, thus not requiring additional disk space.

      Save Content in any Origin Folder

      Serving custom tiles is a challenge, particularly due to the ridiculous amount of tiles required to serve higher zoom levels. The math is simple: for each zoom level you need the following number of tiles:
      4^zoom level

      zoom 0 = 4^0 => 1 tile
      zoom 1 = 4^1 => 4 tiles
      zoom 2 = 4^2 => 16 tiles
      ...
      zoom 20 = 4^20 => 1.099.511.627.776 tiles  (yes, we're talking about trillions here).

      This is challenging both in terms of disk space and time spent to generate the tiles. So, a common approach is to pre-render lower zoom levels (ex: 0-10) and serve the higher zoom level dynamically on demand (also, its also quite desirable to cache these while serving them).

      For this project I'm pre-generating the tiles up to the zoom level 12 (which is still a reasonable number) and dynamically generating higher zoom levels.

      Initially I did setup a CDN to the service that is dynamically generating the tiles but it was quite limiting as it only worked with Cloud-Services, required the /cdn suffix and didn't work well with the routing I had, requiring me to create a custom route with query-string parameters which, although supported by the CDN, wasn't working properly. So, eventually I gave up and was serving the dynamic tiles directly from my webapi hosted directly from a WebProject.

      Example:
      http://tile-win.azurewebsites.net/13/3923/3085.jpg

      With the new Azure feature I can now point a CDN to my existing webapi. Thus I can obtain the same image from the CDN.
      http://az768968.vo.msecnd.net/13/3923/3085.jpg
      So, what's the performance comparison?


      Also, not CDN related

      On this update I also:

      • Completely refactored my loading logic. Now I have separate projects for each step, namely:
        • Converting Geographical data to Vector Tiles
        • Generating Image Tiles from Vector Tiles
        • Pushing Tiles to Azure Blob Storage 
      This change was really important as it allows me to streamline the creation and publication of the tiles going forward.
      • Fixed one of the most tricky bugs I had on the loading logic.
      I had this problem:


      As I explained on one of the posts in this series, I split the geographical data into manageable chunks. When processing the individual tiles some artifacts would be visible on the seams between those chunks.

      I detected this problem a long time ago but I didn't have an immediate solution for it. With the loader refactor I managed to find an elegant solution for the problem. The same area now appears as:

      Note: Eventually will still appear incorrect on the main website due to the CDN caching, which is currently setup to about 1 week.


      Next steps:

      • Improvement to game mechanics

      Creating a simple TileServer with .NET Core RC2 (Part 1 - Setting up the project)

      $
      0
      0
      Part 1. Setting up the the project
      Part 2. Improving drawing logic

      As most of you might have heard Microsoft has recently released .Net core RC2. Although it's still subject to lots of changes I think now is a good time to get on the bandwagon, particularly with the various improvements that have been done.

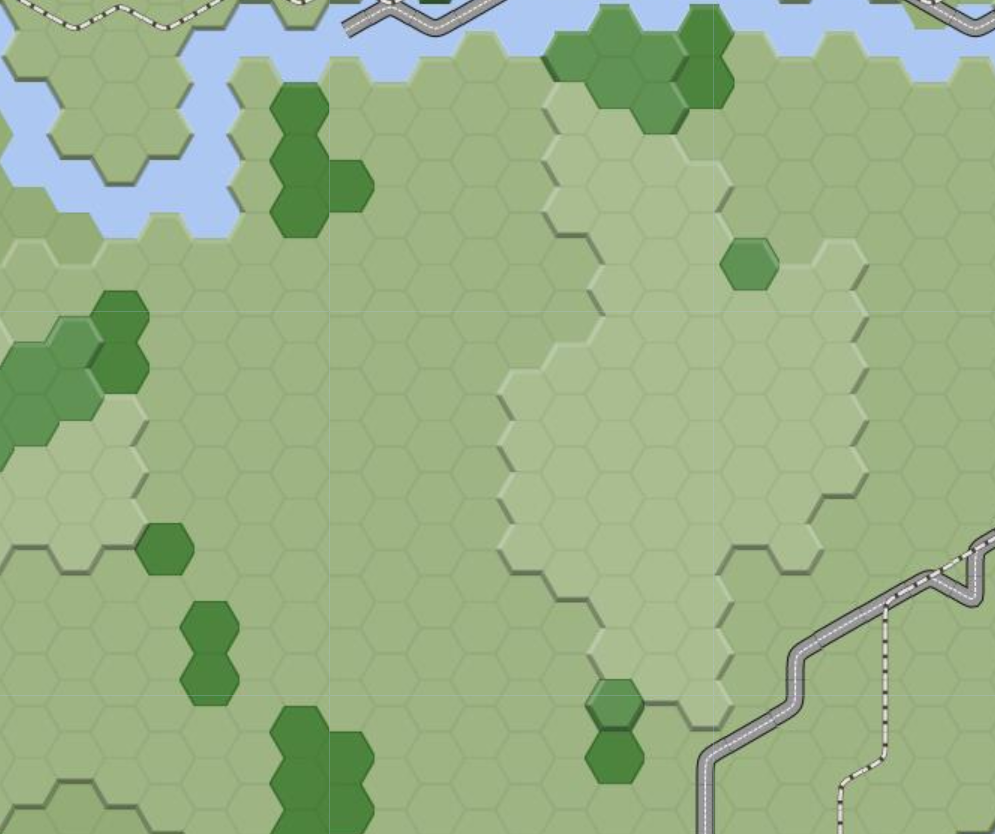
      On this series I'm going to do a cross-platform tile-server that generates tiles with hexagons displayable on a map. As I'm just learning .NET core this will be a learning exercise for me and I'll post all of the steps that I've done in order to achieve the end-result.

      1. First step, install .NET core and Visual Studio

      The instructions on Microsoft's page are actually quite good. I've tried them both on Windows and Mac and worked like a charm. Just don't omit any of the steps (like uninstalling previous versions):

      This page also explains how to setup Visual Studio 2015 and Visual Studio Code. I've actually setup both and I'm forcing myself to also use Visual Studio Code as an exercise to properly understand how the plumbing and client tools work.

      2. Create the project structure

      My project will be structured as:
      • A class library to hold the drawing logic
      • A class library to hold the hexagon logic
      • A unit test project to validate the drawing logic
      • A unit test project to validate the hexagon logic
      • A server that will generate images for specific tile coordinates
      You may ask: "Do you need so many projects for such a simple project?". Definitely not, although useful for a learning exercise.

      The convention for .net core projects is to create a folder for the main projects (under /src) and a folder for the corresponding tests (under /test). Also, a global.json is defined at the top to specify these two main folders. The project structure will be:

      /CoreTiles
      |__global.json
      |__/src
      |__/CoreTiles.Drawing
      |__<files>
      |__project.json
      |__/CoreTiles.Hexagon
      |__<files>
      |__project.json
      |__/CoresTiles.Server
      |__<files>
      |__project.json
      |__/test
      |__/CoreTiles.Drawing.Tests
      |__<files>
      |__project.json
      |__/CoreTiles.Hexagon.Tests
      |__<files>
      |__project.json
      I've started by creating the tree structure in the file-system. Then, inside each project folder creating an empty project using the dotnet cli tool:
      dotnet new
      This creates a console application that ouputs "Hello World", containing both a "project.json" and a "Program.cs" files. A couple of changes need to be done to the default generated projects:
      • The class libraries (CoreTiles.Drawing and CoreTiles.Hexagon) are not executable, so the project.json should be changed. Basically specifying that this project doesn't have an entry execution point and making it more compatible across the board, as "netstandard" can be implemented by multiple .NET platforms. Additional info here
      From:
      {
      "version": "1.0.0-*",
      "buildOptions": {
      "emitEntryPoint": true
      },

      "dependencies": {
      "Microsoft.NETCore.App": {
      "type": "platform",
      "version": "1.0.0-rc2-3002702"
      }
      },
      "frameworks": {
      "netcoreapp1.0": {
      "imports": "dnxcore50"
      }
      }
      }
      To:
      { 
      "version": "1.0.0-*",
      "dependencies": {
      "NETStandard.Library": "1.5.0-rc2-24027"
      },
      "frameworks": {
      "netstandard1.5": {
      "imports": "dnxcore50"
      }
      }
      }
      • The test projects are slightly different, as they're actually executables. Regardless, the Main method is provided by the test runner, which in this case is xunit. So, the entry point should be removed and the xunit dependencies should be added:
      From:
      {
      "version": "1.0.0-*",
      "buildOptions": {
      "emitEntryPoint": true
      },
      "dependencies": {
      "Microsoft.NETCore.App": {
      "type": "platform",
      "version": "1.0.0-rc2-3002702"
      }
      },
      "frameworks": {
      "netcoreapp1.0": {
      "imports": "dnxcore50"
      }
      }
      }
      To:
      {
      "version": "1.0.0-*",
      "testRunner": "xunit",

      "dependencies": {
      "Microsoft.NETCore.App": {
      "type":"platform",
      "version": "1.0.0-rc2-3002702"
      },
      "xunit":"2.1.0",
      "dotnet-test-xunit": "1.0.0-rc2-build10015"

      },
      "frameworks": {
      "netcoreapp1.0": {
      "imports": [
      "dnxcore50",
      "portable-net45+win8"
      ]
      }
      }
      }
      • The server project (CoreTiles.Server) is an actual console application, so doesn't need to be changed (for now)
      3. Create the Server Web API 

      Start by adding the various dependencies to project.json
      "dependencies": {
      "Microsoft.NETCore.App": {
      "version": "1.0.0-rc2-3002702",
      "type": "platform"
      },
      "Microsoft.AspNetCore.Mvc": "1.0.0-rc2-final",
      "Microsoft.AspNetCore.Server.Kestrel": "1.0.0-rc2-final"
      }
      On RC1 a MVC project did the wiring up of the Startup class automatically. On RC2 this is a regular console app. As such, all the plumbing needs to be done explicitly on Main:
      public class Program
      {
      public static void Main(string[] args)
      {
      var host = new WebHostBuilder()
      .UseKestrel()
      .UseContentRoot(Directory.GetCurrentDirectory())
      .UseStartup<Startup>()
      .Build();

      host.Run();
      }
      }
      We need to register the MVC framework on the pipeline
      public void ConfigureServices(IServiceCollection services)
      {
      // Add framework services.
      services.AddMvc();
      }

      // This method gets called by the runtime.
      // Use this method to configure the HTTP request pipeline.
      public void Configure(
      IApplicationBuilder app, IHostingEnvironment env, ILoggerFactory loggerFactory)
      {
      app.UseMvc();
      }
      Now creating a controller that will return a tile images, depending on specified parameters (z/x/y).

      I've created a simple TileController with this signature:
      [Route("[controller]")]
      public class TileController : Controller
      {
      [HttpGet("{z}/{x}/{y}")]
      public IActionResult Get(int z, int x, int y)
      {
      return Ok();
      }
      }

      Now I'm just missing:
      • Returning an actual image
      • Creating a map view that uses this API 
      The map image being returned needs to be generated dynamically. Luckily there's a component that
      does exactly that, including support for .NET Core: ImageProcessor.
      Unfortunately ImageProcessor doesn't yet include drawing capabilities so I'll need to extend it to include some simple drawing actions (like drawing lines, rectangles, polylines, etc).

      Thus, for this first post I'll just return a simple red square for each tile. I'll do the proper hexagon drawing on the next post, on which I'll do some extensions to ImageProcessor.
      [Route("[controller]")]
      public class TileController : Controller
      {
      private const int TileSize = 256;

      [HttpGet("{z}/{x}/{y}")]
      public async Task<IActionResult> Get(int z, int x, int y)
      {
      using (Image image = new Image(TileSize, TileSize))
      using (var outputStream = new MemoryStream())
      {
      //Drawing code goes here

      image.SaveAsPng(outputStream);

      var bytes = outputStream.ToArray();

      Response.ContentType = "image/png";
      await Response.Body.WriteAsync(bytes, 0, bytes.Length);
      return Ok();
      }
      }
      }
      As the Image class of ImageProcessor only supports putting and getting individual pixels creating a square method is quite simple:
      public static void DrawRectangle(this Image image, int x, int y, 
      int width, int height, Color color)
      {
      //Draw horizontal lines
      for(var i = x; i < x + width; i++)
      {
      image.SetPixel(i, y, color);
      image.SetPixel(i, y + height - 1, color);
      }

      //Draw vertical lines
      for(var j=y+1; j < y + height; j++)
      {
      image.SetPixel(x, j, color);
      image.SetPixel(x + width - 1, j, color);
      }
      }
      Updated the Tile drawing logic to:
      [Route("[controller]")]
      public class TileController : Controller
      {
      private const int TileSize = 256;

      [HttpGet("{z}/{x}/{y}")]
      public async Task<IActionResult> Get(int z, int x, int y)
      {
      using (Image image = new Image(TileSize, TileSize))
      using (var outputStream = new MemoryStream())
      {
      image.DrawRectangle(0,0,256,256,Color.Red);

      image.SaveAsPng(outputStream);

      var bytes = outputStream.ToArray();

      Response.ContentType = "image/png";
      await Response.Body.WriteAsync(bytes, 0, bytes.Length);
      return Ok();
      }
      }
      }
      Running the CoreTile.Server app (dotnet run) and opening a browser at: http://localhost:5000/tile/0/0/0 shows this:

      Now I'll create a web-page to show a simple map using this new tile-layer.

      I'm going to use Openlayers 3 for this, particularly as I've been wanting to experiment with it for some time.

      First I need to change the Startup class to define a proper default routing logic as well as being able to serve static files from the server.
      public void Configure(IApplicationBuilder app)
      {
      app.UseStaticFiles();

      app.UseMvc(routes =>
      {
      routes.MapRoute(
      name: "default",
      template: "{controller=Home}/{action=Index}");
      });
      }
      }
      Then creating a simple controller to serve the main View
      public class HomeController : Controller
      {
      public IActionResult Index()
      {
      return View();
      }
      }
      And finally the actual view
      <!DOCTYPE html>
      <html>
      <head>
      <title>Canvas Tiles</title>
      <link rel="stylesheet" href="http://openlayers.org/en/v3.16.0/css/ol.css"
      type="text/css">
      <script src="http://openlayers.org/en/v3.16.0/build/ol.js">
      </script>
      </head>
      <body>
      <div id="map" class="map"></div>
      <script>
      var osmSource = new ol.source.OSM();
      var map = new ol.Map({
      layers: [
      new ol.layer.Tile({
      source: osmSource
      }),
      new ol.layer.Tile({
      source: new ol.source.XYZ({
      url: "/tile/{z}/{x}/{y}"
      })
      }),
      ],
      target: 'map',
      controls: ol.control.defaults({
      attributionOptions: ({
      collapsible: false
      })
      }),
      view: new ol.View({
      center: ol.proj.transform(
      [-0.1275, 51.507222], 'EPSG:4326', 'EPSG:3857'),
      zoom: 10
      })
      });
      </script>
      </body>
      </html>

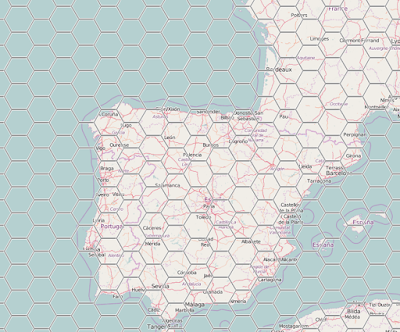
      Running the application and opening http://localhost:5000 shows the basemap with the dynamically generated tiles


      I've tried this both on a Mac and a Windows. I'm assuming it should also work without any problem in Linux.

      The complete code can be viewed at: https://github.com/pmcxs/CoreTiles

      Reference:


      Creating a simple TileServer with .NET Core 1.0 (Part 2 - Drawing Lines)

      $
      0
      0
      Part 1. Setting up the the project
      Part 2. Improving drawing logic

      On my last post I've setup an asp.net core project which outputs simple maps tiles dynamically generated using the ImageProcessor library (which now supports .NET Core).

      As I've mentioned that lib doesn't yet include drawing functionality, so on this post I'll try to address that as a pre-requisite to being able to draw proper map tiles. For now I'll focus on drawing lines, including support for variable width and anti-aliasing, doing some benchmarking along the way to make sure that the performance is adequate.

      By-the-way, since my first post the proper 1.0 release has been launched, so I'm also updating the code to reflect the latest bits :)

      Lots of stuff to do so let's get started:

      1. Drawing simple lines

      For drawing lines I've used Bresenham's line algorithm. It's really simple to implement and provides accurate and fast results. The implementation (for all 4 quadrants) is:
      void DrawLine(Image image, int x1, int y1, int x2, int y2, Color color)
      {
      int w = x2 - x1;
      int h = y2 - y1;
      int dx1 = 0, dy1 = 0, dx2 = 0, dy2 = 0;
      if (w < 0) dx1 = -1; else if (w > 0) dx1 = 1;
      if (h < 0) dy1 = -1; else if (h > 0) dy1 = 1;
      if (w < 0) dx2 = -1; else if (w > 0) dx2 = 1;
      int longest = Math.Abs(w);
      int shortest = Math.Abs(h);
      if (!(longest > shortest))
      {
      longest = Math.Abs(h);
      shortest = Math.Abs(w);
      if (h < 0) dy2 = -1; else if (h > 0) dy2 = 1;
      dx2 = 0;
      }
      int numerator = longest >> 1;
      for (int i = 0; i <= longest; i++)
      {
      image.SetPixel(x1, y1, color);

      numerator += shortest;
      if (!(numerator < longest))
      {
      numerator -= longest;
      x1 += dx1;
      y1 += dy1;
      }
      else
      {
      x1 += dx2;
      y1 += dy2;
      }
      }
      }
      I'm drawing the following lines with it:

      _lineDrawing.DrawLine(image, 0, 0, 255, 255, Color.Red);
      _lineDrawing.DrawLine(image, 0, 255, 255, 0, Color.Red);
      _lineDrawing.DrawLine(image, 0, 63, 255, 191, Color.Red);
      _lineDrawing.DrawLine(image, 0, 191, 255, 63, Color.Red);
      _lineDrawing.DrawLine(image, 0, 127, 255, 127, Color.Red);
      _lineDrawing.DrawLine(image, 127, 0, 127, 255, Color.Red);
      _lineDrawing.DrawLine(image, 63, 0, 191, 255, Color.Red);
      _lineDrawing.DrawLine(image, 191, 0, 63, 255, Color.Red);
      The end-result is this:
      Regarding performance, on my laptop (a pretty standard machine) it takes in average 15 ms to render this particular tile. The actual drawing logic for these 8 lines takes less than 0.5 ms and outputting the png around 12 ms.

      2. Adding thickness to the line

      This was actually trickier than I had anticipated. I had two different approaches to this:

      First approach:
      • Drawing a regular simple line
      • For each point create 2 perpendicular lines (one for each direction) a draw it up to a certain distance
      Second approach:
      • Calculate the perpendicular points at the start and end of the line
      • Draw various parallel lines to the main one, until achieving a certain width.
      Both approaches apparently worked, although I was obtaining consistently better performance with the second approach.

      Unfortunately there was a problem I hadn't anticipated. When drawing parallel lines it's possible that you end up with spaces between them if the perpendicular (normal) points represent both an horizontal and vertical step.


      To solve this I've changed the drawing logic to pick the points on the normal without doing any diagonals. I've actually used a modified Bresenham's algorithm for this. The end-result is conceptually like this:

      Applying this logic to the previous star pattern with a width of 5:
      Regarding performance, adding the thickness to the drawing algorithm was not noticeable in the overall time, and the full drawing logic still takes less than 1 ms.

      Unfortunately, when zooming in we can see it's quite pixelated (aliased).
      Original (zoomed)

      3. Adding anti-aliasing support

      I also have two different approaches to solve this problems:

      First approach:
      • When drawing the parallel lines use a different algorithm to draw the ones on both edges with a line algorithm that supports anti-aliasing, such as Xiaolin Wu's

      Second approach:
      • Draw everything on an higher resolution and then scale the image down. 

      Went with approach two (scale down) and this is the end-result:

      Downscalling (zoomed)
      I was pretty happy with the result. Unfortunately from a performance point-of-view it's far from ideal and the tile rendering time more than doubled.

      So, back to the drawing board (ah!) to try the other approach: supporting anti-aliasing on the line drawing algorithm itself, using Xiaolin Wu's line algorithm:

      Bresenham's line (zoomed)
      Xiaolin Wu's line (zoomed)

      The implementation is slightly more complex than Bresenham, but its performance is pretty reasonable.

      For the full implementation please check my github repo.


      On the top images you can see how it compares with Bresenham algorithm, providing a subtle anti-aliasing.

      So, to support anti-aliased lines with variable widths I'm going to:
      • Use the first strategy I've shown do draw multiple parallel lines to achieve a thick line
      • Drawing the lines furthest away from the main line using Xiaolin Wu's line algorithm
      • Drawing all the other lines with Bresenham's line algorithm
      The end-result is (zooming in):

      Mixing Bresenham and Xiaolin Wu (zoomed)
      The anti-aliasing is not as strong as the downscaled version but its performance is much better. Also, on a non-zoomed view the aliasing is mostly negligible:
      Mixing Bresenham and Xiaolin Wu (original size)

      Also, in order to properly support transparent pixels I had to include a proper color blending routine. Otherwise, when setting a semi-transparent pixel on top of an existing color it would replace it altogether.

      Thus, in these cases I've just added the following code:
      public static Color BlendColor(Color bg, Color fg)
      {
      var r = new Color();

      r.A = 1 - (1 - fg.A) * (1 - bg.A);
      if (r.A < 1.0e-6) return r; // Fully transparent -- R,G,B not important
      r.R = fg.R * fg.A / r.A + bg.R * bg.A * (1 - fg.A) / r.A;
      r.G = fg.G * fg.A / r.A + bg.G * bg.A * (1 - fg.A) / r.A;
      r.B = fg.B * fg.A / r.A + bg.B * bg.A * (1 - fg.A) / r.A;

      return r;
      }

      This tile gives an actual funky effect on top of a map


      4. Drawing hexagons

      Now that I've got a reasonable toolset I'm able to create the hexagon tiles layer to overlay on the map. I'm not going to post all the relevant code here so feel free the take a look at the source-code on the corresponding github repo.

      The end-result is far from astonishing but shows the effect I was going for.

      zoom level 6
      zoom level 8
      This was a fun experiment but I expect it to get obsolete in the short-term, particularly as soon as Microsoft includes proper drawing methods in System.Drawing. Thus I'm not planning in taking it any further. Regardless, I might reuse some of these bits on other stuff.

      The complete code can be viewed at: https://github.com/pmcxs/CoreTiles

      Splitting vector and raster files in QGIS (Part 2 - Creating a proper QGIS plugin)

      $
      0
      0
      Part 1. Splitting vector and raster files in QGIS
      Part 2. Creating a proper QGIS plugin

      On my previous post I've created a python script which could be executed inside QGIS in order to split the various layers onto smaller, more manageable chunks.

      I've been wanting to create a proper QGIS plugin to package that logic for some time but I've been postponing it as I was expecting it to be slightly tricky, mostly due to the fact that I've never done a QGIS plugin before and anticipated that it could quite challenging.

      Truth be told, it was actually quite simple. Due to a mix of awesome online documentation and some starter tools this was mostly a straightforward process.

      Let me start by showing the end-result and them I'll explain how it was built.

      The plugin:

      It's called "Geo Grid Cut" and it basically receives as input all the layers of a map. For example, assuming we have the following layers open on QGIS


      After installing (I'll talk about that later) the plugin can be accessed on the "plugins" menu on option "Geo Grid Cut":


      It provides various options but for now I'm just going to split a small custom area in Europe


      For this particular example the end-result is 6 zip files, each corresponding to an area of 10x10 (degrees) that includes the corresponding features of all 4 layers inside that area.

      Creating the plugin:

      I was very pleasantly surprised that this process is so well documented here: http://www.qgistutorials.com/en/docs/building_a_python_plugin.html

      Besides providing a detailed explanation it's also very "iterative" in the sense that in 5 min you have something up and running.

      As that page includes most required info I'll just add some additional considerations:
      • After installing the Qt Creator and the Python Bindings for Qt my "make" command was not working. On MacOsX a restart was needed
      • (at least on MacOSX) Be careful with the casing on the plugin name and the corresponding folder on disk. If you name your plugin as "MyFirstPlugin" be sure to also name the repo as "MyFirstPlugin". For simplicity I would simply keep everything lowercase
      • Most existing plugins are open-source, which is particularly useful to see how things are done
      • By default you'll have a python "<plugin>_dialog_base.py" and a "<plugin>.py" file. Keep the UI logic on the corresponding "dialog" python file. Keeps thinks cleaner

      Additional plugin parameters:

      The plugin includes some additional configuration options:
      • Extent - Defines the bounding box that will be split into smaller chunks
        • Layers - Automatically sets the extent to cover all the layers on the map (default)
        • Canvas - Will use the current viewport to set the extent
        • Custom - Set the coordinates for the bounding box manually
      • Grid Size
        • Width - Width of each cell of the grid (in degrees)
        • Height - Height of each cell of the grid (in degrees)
        • Buffer - Defines the overlap (for each direction) when creating the grid cells. For example, if a buffer is set to anything > 0 an area around the edges will be shared by various cells. This is useful to prevent gaps between cells when processing the resulting output.
      • Output
        • Folder - Base folder where the output will be placed
        • Compress output - If checked will create a zip file for each cell. Otherwise an uncompressed folder will be created
        • Create boundaries description file - For each cell creates a description file that indicates the coordinates for that cell boundaries

      Source-code and Installing

      The source-code is available at: https://github.com/pmcxs/geogridcut

      To install locally the easiest way is to:
      • Go to the QGIS folder and clone the plugin's repo with its default name
      cd /Users/<username>/.qgis2/python/plugins
      git clone https://github.com/pmcxs/geogridcut

      • Launch (or relaunch) QGIS and go to "Plugins > Manage and Install Plugins"
      • Under the "Installed" section you'll see "Geo Grid Cut" there. Press the checkbox near its name to activate it
      • The plugin should now appear on the plugins menu, ready to use :)

      Playing with Mapbox Vector Tiles (Part 1 - End-to-end experiment)

      $
      0
      0
      Part 1. End-to-End experiment 
      Part 2. Generation custom tiles

      So, what are vector tiles?

      For those that are not familiar with this approach, it provides an alternative to raster tiles where the main difference is that vector tiles provide data instead of a rendered image, although still using a similar xyz tiling structure.

      This provides some benefits, such as the ability to have meta-data associated with the tile and being able to generate different presentations for the same information.

      One of the problems is that there isn't an official standard for vector tiles. Regardless, with time, a particular vector tile format seems to have gained more traction than all others: the Mapbox Vector Tiles.

      Mapbox has provided a consistent ecosystem around it and various providers have started to support it and, on this post, I'm going to play around with some of the existing technology around Mapbox Vector Tiles.
      First, showing an actual example from Mapbox: https://www.mapbox.com/mapbox-gl-js/examples/


      This page uses:
      • Vector tiles hosted by Mapbox
      • Mapbox GL: a browser plugin to render Mapbox Vector Tiles using WebGL
      The interesting part is that everything is being rendered in client-side, thus allowing for a really smooth transition between zoom levels and lots of flexibility, particularly as the styles are also applied in client-side.

      So, how can we use this technology for our own maps?

      1. Using Mapbox Studio

      The obvious choice is using Mapbox Studio, an online service where you can load data, style and publish the maps without much fuss. Mapbox provides various price ranges, with a free tier that allows 50.000 map views per month, which seems pretty reasonable to test it out.

      2. Serving the Mapbox Vector Tiles (mvt) ourselves

      Although Mapbox provides a paid service they don't force you to use it. The mvt spec is open and other libs/apps are able to read/write that format. Mapbox mantains a list of such projects here: https://github.com/mapbox/awesome-vector-tiles

      So, to setup a local server there are various choices but I found the easiest one to be tileserver-gl. Setting it up was a breeze using npm:
      npm install -g tileserver-gl-light

      and to run it:
      tileserver-gl-light <map>

      Note: There's a "tileserver-gl" and a "tileserver-gl-light". The full version also supports a model were it renders the vector tiles in server-side and serves them as rasters to the client. I'm using the light version for simplicity.
      So now we need the actual map data to display. https://openmaptiles.org/downloads/ provides MVT files for the whole world, ready to use. I've downloaded the Portuguese map using the following command:
      curl -o portugal.mbtiles https://openmaptiles.os.zhdk.cloud.switch.ch/v3.3/extracts/portugal.mbtiles

      Then I can just run the server as:
      tileserver-gl-light portugal.mbtiles

      It should be running properly on http://localhost:8080
      http://localhost:8080/styles/osm-bright/?vector#5.91/40.357/-5.857
      Zooming in we can see that the tile info is being fetched from the server and rendered accordingly.
      http://localhost:8080/styles/osm-bright/?vector#15.91/38.7109/-9.3284
      Also, to prove that the rendering is actually being done in client-side, one can actually use a different style for the same data, which yields totally different results. Tile-server gl actually includes two different styles by default: osm-bright and klokantech-basic. Changing the "osm-bright" part of the url to "klokantech-basic":
      http://localhost:8080/styles/klokantech-basic/?vector#15.91/38.7109/-9.3284
      3. Changing the style

      Now I'm going to create a new style for the map. Creating one from scratch is very hard-work so I'll simply copy an existing one and change it slightly.

      Some steps required to do this in tileserver-gl:
      • Run the server with a --verbose argument to know the default config
      It will show the default configuration file, including a section with the root path under /options/paths/root

      Automatically creating config file for portugal.mbtiles
      {
      "options": {
      "paths": {
      "root":"/Users/pedrosousa/.nvm/versions/node/v6.10.0/lib/node_modules/tileserver-gl-light/node_modules/tileserver-gl-styles",
      "fonts":"fonts",
      "styles":"styles",
      "mbtiles":"/Users/pedrosousa/Projects/vectorTiles"
      }
      },
      • On that root folder there is a "styles" subolder with a folder for each style, particulary "klokantech-basic" and "osm-bright". I'm going to copy "klokantech-basic" as it's simpler to a new folder called "custom"
      • Inside I'm just going to change a couple of properties:
        • Name: "Custom"
        • Background-Color to white: "rgba(255, 255, 255, 1)"  
        • Water Fill-Color to be a dark blue: "rgba(12, 55, 84, 1)"
      • Last, I need to add this new style to the tileserver-gl configuration file. As I've been using the default one I actually need to create a new file. The easiest way is to copy the output obtained on the first step and just add the new style copying one of the others. For reference this is my file:
      {
      "options": {
      "paths": {
      "root":"/Users/pedrosousa/.nvm/versions/node/v6.10.0/lib/node_modules/tileserver-gl-light/node_modules/tileserver-gl-styles",
      "fonts":"fonts",
      "styles":"styles",
      "mbtiles":"/Users/pedrosousa/Projects/vectorTiles"
      }
      },
      "styles": {
      "klokantech-basic": {
      "style":"klokantech-basic/style.json",
      "tilejson": {
      "bounds": [
      -31.6575302,
      29.7288021,
      -6.0891591,
      42.2543112
      ]
      }
      },
      "custom": {
      "style":"custom/style.json",
      "tilejson": {
      "bounds": [
      -31.6575302,
      29.7288021,
      -6.0891591,
      42.2543112
      ]
      }
      },
      "osm-bright": {
      "style":"osm-bright/style.json",
      "tilejson": {
      "bounds": [
      -31.6575302,
      29.7288021,
      -6.0891591,
      42.2543112
      ]
      }
      }
      },
      "data": {
      "v3": {
      "mbtiles":"portugal.mbtiles"
      }
      }
      }
      • Now you need to launch the server with a "-c" property to specify the new configuration file that was just created. Assuming it's called "config.json":
      tileserver-gl-light portugal.mbtiles -c config.json
      • Voilá. Now opening the browser with the corresponding "/custom" style will show the updated map style

      4. Serving the vector tiles directly without a tile-server

      Although I would recommend having a tile-server (particularly with a nginx front-facing it) sometimes one might want to serve the individual tiles directly.

      The easiest way is probably to use another tool from mapbox called mb-util to extract the tiles from the .mbtiles file.

      I've used the steps that I've found on this page: https://github.com/klokantech/vector-tiles-sample

      1. After installing mbutil you can run the following command on the folder where you have your mbtiles file
      mb-util --image_format=pbf portugal.mbtiles portugal

      2. We still need to extract them as they're usually gzipped.
      gzip -d -r -S .pbf *

      3. After extracting the pbf extension is lost. The following command iterates the various files and puts a .pbf extension on them again:
      find . -type f -exec mv '{}''{}'.pbf \;

      Ok, now that we have our tiles we're ready to serve them. We just need a very simple index.html file:
      <!DOCTYPE html>
      <html>

      <head>
      <metacharset='utf-8'/>
      <title>Vector Map with Mapbox GL JS</title>
      <metaname='viewport'content='initial-scale=1,maximum-scale=1,user-scalable=no'/>
      <style>
      body {
      margin:0;
      padding:0;
      }
      #map {
      position:absolute;
      top:0;
      bottom:0;
      width:100%;
      }
      </style>
      </head>

      <body>
      <script src='https://api.mapbox.com/mapbox-gl-js/v0.32.1/mapbox-gl.js'></script>
      <divid='map'></div>
      <script type="text/javascript">

      var map =new mapboxgl.Map({
      container:'map',
      center: [12, 1],
      zoom:1,
      style:'style.json'
      });
      </script>
      </body>

      </html>
      Most of the relevant information comes from the style.json file that I'm referencing on the map definition.

      I'm not going to put the entire style file here as it's quite big and is mostly a copy from the klokantech-basic I've mentioned above. The relevant bits are:
      {
      "sources": {
      "openmaptiles": {
      "type": "vector",
      "tiles": [
      "http://localhost:8000/portugal/{z}/{x}/{y}.pbf"
      ]
      }
      }
      }
      Basically setting up the source of the tiles to the folder that we've extracted.

      Now running a simple web-server on the folder (ex: using Python Simple Server)
      python -m SimpleHTTPServer

      Opening http://localhost:8000 should show a map similar to the one we had before using tileserver-gl, although with a slightly different url pattern. The tiles are being served directly from the web-server without any translation layer in the middle

      Ok, that's it for now. Next post: generating my own vector tiles

      Playing with Mapbox Vector Tiles (Part 2 - Generating custom tiles)

      $
      0
      0
      Part 1. End-to-End experiment
      Part 2. Generating custom tiles

      On my previous post I've played around with various tools on the Mapbox vector tiles ecosystem. On this post I'm taking it further: generating my own vector tiles.

      There are various options to generate vector tiles:
      • using a server that generates the vector tiles dynamically based on other data (such as PostGIS)
      • programatically generating the protobuf (rolling your own code or using existing libs)
      • using a tool that receives various inputs and outputs the corresponding vector tiles, which can then be used as shown on my previous post
      Most options for these approaches are properly identified at this page: https://github.com/mapbox/awesome-vector-tiles

      On this post I'm going to focus on this third option, particularly using a tool from Mapbox called Tippecanoe. I'm not an expert on any of these alternatives (I'm learning as I'm writing this post) but Tippecanoe seems incredibly robust, including a great deal of customisation options when generating the tiles.

      So, first things first, what exactly is Tippecanoe?

      It's simply a command-line tool that receives one or more GeoJson files as input and generates the corresponding vector tiles.

      The readme is great so I'm not going to duplicate everything on this post. Basically installing is as simple as:
      brew install tippecanoe

      And running as
      tippecanoe -o file.mbtiles [file.json ...]

      Let me create a very basic map to see how this works.
      • To convert a Shapefile to Geojson the easiest way is probably to use ogr2ogr from GDAL with the following command:
      ogr2ogr -f GeoJSON -t_srs crs:84 world.geojson ne_10m_admin_0_countries.shp
      (Alternatively, for a UI driven experience, I would suggest opening it in QGis and simply saving the map as GeoJSON)
      • Now running tippecanoe on it:
      tippecanoe -o world.mbtiles -z6 world.geojson

      The "z" param is used to specify the highest zoom level to which tiles are generated. The default of 14 would take a looong time to finish. For the sake of this demo I'm going to keep things small and fast. For reference each zoom level requires 4^(zoom level) tiles.

      After the tiles are generated we end-up with a .mbtiles file. This is basically a SQLite database including all the generated tiles inside, making it quite convenient to store, transfer and use.

      I can try these vector tiles immediately but, without a style, nothing would be displayed. Fortunately tileserver-gl also provides a "data" mode where it shows the various layers of a mbtiles set.

      So, simply running it against my "world.mbtiles" output from the previous step:
      tileserver-gl-light world.mbtiles

      Opening http://localhost:8080/data/world will show our map with a single layer called "worldgeojson"

      I'm ready to create my style:

      Using an editor is obviously ideal (I'll get to that later) but we can easily create a really dumb style "by hand":

      style.json
      {
      "version": 8,
      "sources": {
      "myworldmap": {
      "type": "vector",
      "url": "mbtiles://{v3}"
      }
      },
      "layers": [
      {
      "id": "background",
      "type": "background",
      "paint": {
      "background-color": "rgb(200, 200, 255)"
      }
      },
      {
      "id": "countries",
      "type": "fill",
      "source": "myworldmap",
      "source-layer": "worldgeojson",
      "paint": {
      "fill-color": "rgb(200,100,50)"
      }
      }
      ]
      }

      This is basically:
      • Creating a source for vector tiles (as in defining where to load the tiles from)
      • Creating a style layer to paint the background with a blue color
      • Creating a style layer that points to the "worldgeojson" layer from the vector data and filling it with a flat color
      To use it with tileserver-gl I had to create a simplified configuration file:

      config.json
      {
      "options": {
      "paths": {
      "root": ".",
      "styles": ".",
      "mbtiles": "."
      }
      },
      "styles": {
      "world": {
      "style": "style.json"
      }
      },
      "data": {
      "v3": {
      "mbtiles": "world.mbtiles"
      }
      }
      }

      Running tileserver-gl as:
      tileserver-gl-light -c config.json world.mbtiles 

      Opening a page at: http://localhost:8080/styles/world/#0/0/0 will show our custom map with our custom style:

      Creating the styles manually is not very practical. Fortunately there are various tools that might help with that:
      It provides a rich UI where one can define colors, filters, fonts, etc in a very user friendly fashion.


      It's particularly useful for maps created and hosted in Mapbox. Regardless, you can still edit the styles online and then download them to use with your local mbtiles, although requiring a little bit of editing on the output to point to the relevant sources.

      This is just a page with the map on one side and the Json style on the other. Simple and effective, although doesn't provide many bells and whistles.
        This is actually an open-source editor that provides some of the functionality of Mapbox Studio without any restrictions.

        Using it is very simple. You can either go directly to http://maputnik.com/editor/ or clone the git repo from https://github.com/maputnik/editor and run it as:

        npm install
        npm start

        By default the editor runs on port 8888. The first thing to do is to add a source for our generated tiles. If you still have tileserver-gl running from one of the previous steps you'll have a tilejson file automatically prepared at: http://localhost:8080/data/v3.json.

        Go to "Source" on the top and create a new source as:


        • Source ID: mysource
        • Source Type: Vector (TileJSON URL)
        • TileJSON URL: http://localhost:8080/data/v3.json
        Afterwards we're ready to create a new layer that references data from this particular source. Press Add Layer on the left and add the layer data:


        Also, create another layer for the background:


        Now just choose a flat color for these layers. You'll end-up with something like this:

        That's it for now. On my third and final post I'm going to build up on these techniques and do something more advanced/interesting.


        Creating a large Geotif with Forest Coverage for the whole World

        $
        0
        0
        For a pet-project that I'm making I was trying to find accurate forest coverage for the whole World.

        A raster file seemed more adequate and I wanted something like this, but with a much higher resolution (and ideally already georeferenced)


        I found the perfect data-source from Global Forest Watch: https://www.globalforestwatch.org/

        Global Forest Watch provide an incredible dataset called "Tree Cover (2000)" that has a 30x30m resolution which includes the density of tree canopy coverage overall.

        It's too good to be true, right?

        Well, in a sense yes. The main problem is that it's just too much data and you can't download the image as a whole.

        Alternatively, they provide you an interactive map where you can download each section separately, at: http://earthenginepartners.appspot.com/science-2013-global-forest/download_v1.6.html

        This consists of 504 (36x14) images, already georeferenced. For example, if you download the highlighted square above you'll get the the following picture:
        https://storage.googleapis.com/earthenginepartners-hansen/GFC-2018-v1.6/Hansen_GFC-2018-v1.6_treecover2000_50N_010W.tif
        It's "just" 218MB, hence you can somehow imagine the size of the whole lot. Should be massive.

        So, three challenges:
        1. How to download all images
        2. How to merge them together to a single file
        3. (Optional, but recommended) Reducing the resolution a bit to make it more manageable 

        1. How to Download all images

        Well, doing it manually is definitively an option, although it's probably easier to do it programmatically.
        import ssl
        import urllib.request

        ctx = ssl.create_default_context()
        ctx.check_hostname = False
        ctx.verify_mode = ssl.CERT_NONE

        sections = []

        for i in range(8,-6,-1):
        for j in range(-18,18):
        sections.append(f'{abs(i)*10}{"N" if i >= 0 else "S"}_{str(abs(j)*10).zfill(3)}{"E" if j >= 0 else "W"}')

        for section in sections:
        url = 'https://storage.googleapis.com/earthenginepartners-hansen/GFC-2018-v1.6/' + \
        f'Hansen_GFC-2018-v1.6_treecover2000_{section}.tif'

        with urllib.request.urlopen(url, context=ctx) as u, open(f"{section}.tif", 'wb') as f:
        f.write(u.read())

        The code above, in Python 3.x, iterates all the grid squares, prepares the proper download url and downloads the image.

        As the https certificate isn't valid you need to turn off the ssl checks, hence the code at the beginning.

        2. How to merge them together to a single file

        It's actually quite simple, but you'll need GDAL for that, hence you'll need to install it first.

        gdal_merge is incredibly simple to use:

        gdal_merge.py -o output-file-name.tif file1.tif file2.tif fileN.tif

        Adding to those parameters I would suggest compressing the output, as otherwise an already large file could become horrendously huge.

        gdal_merge.py -o output-file-name.tif <files> -co COMPRESS=DEFLATE

        And that's it. I'll show how this all ties together on the Python script in the end, but you can "easily" do it manually if you concatenate the 504 file names on this command.

        3. Reducing the resolution a bit to make it more manageable 

        As I've mentioned, the source images combined result in lots and lots of GBs, which I currently don't have available on my machine. Hence, I've reduced the resolution of each image.

        Please note that this isn't simply a resolution change on a Graphics Software, as it needs to preserve the geospatial information. Again, GDAL to the rescue, now using the gdalwarp command:
        gdalwarp -tr 0.0025 -0.0025 file.tif

        The first two parameters represent the pixel size. From running the command gdalinfo on any of the original tifs I can see that the original pixel size is:

        Pixel Size = (0.0002500000000000,-0.0002500000000000)

        Empirically I've decided to keep 1/10th of the original precision, hence I've supplied the aforementioned values (0.0025 -0.0025)

        As before, I would suggest compressing the content
        gdalwarp -tr 0.0025 -0.0025 file.tif -co COMPRESS=DEFLATE

        You do lose some quality, but it's a trade-off. If you have plenty of RAM + Disk Space you can keep an higher resolution.

        Original
        1/10th of resolution
        Final script

        The following Python 3 does everything in one go. The interesting bit is that I change the resolution of each individual tile before merging the complete map. The script also cleans up after itself, only leaving the final tif file, named "treecover2000.tif"
        import ssl
        import urllib.request
        import os

        ctx = ssl.create_default_context()
        ctx.check_hostname = False
        ctx.verify_mode = ssl.CERT_NONE
        extension = ".small.tif"
        sections = []

        for i in range(8,-6,-1):
        for j in range(-18,18):
        sections.append(f'{abs(i)*10}{"N" if i >= 0 else "S"}_{str(abs(j)*10).zfill(3)}{"E" if j >= 0 else "W"}')

        for section in sections:
        print(f'Downloading section {section}')
        url = 'https://storage.googleapis.com/earthenginepartners-hansen/GFC-2018-v1.6/' + \
        f'Hansen_GFC-2018-v1.6_treecover2000_{section}.tif'

        with urllib.request.urlopen(url, context=ctx) as u, open(f"{section}.tif", 'wb') as f:
        f.write(u.read())

        os.system(f'gdalwarp -tr 0.0025 -0.0025 -overwrite {section}.tif {section}{extension} -co COMPRESS=DEFLATE')
        os.system(f'rm {section}.tif')

        os.system(f'gdal_merge.py -o treecover2000.tif { (extension + "").join(sections)}{extension} -co COMPRESS=DEFLATE')
        os.system(f'rm *{extension}')

        The "treecover2000.tif" ends-up with 751MB and looks AWESOME. Zooming in on Portugal, Spain and a bit of France

        Viewing all 63 articles
        Browse latest View live