Quantcast
Channel: Pedro's Tech Mumblings
Viewing all 63 articles
Browse latest View live

Displaying WebGL data on Google Maps

$
0
0
Off-topic:
I haven't really payed too much attention to my blog lately. A mix of several projects have kept me occupied and without much time to write. Anyway, I've got some posts on the "pipeline" and I'll try to make up for the lost time :)


On-topic:
Recently I watched a video from the Google Maps Team (don't remember the link, sorry) were I was blown away by a demo using WebGL on top of a map. Basically it displayed thousands and thousands of points on a map without any performance hit whatsoever. I was very interested in exploring the demo and fortunately the Google lads were nice enough to create a simplified version of it inside the Google Maps Utility Library.

You can view this demo directly from the library repository here.


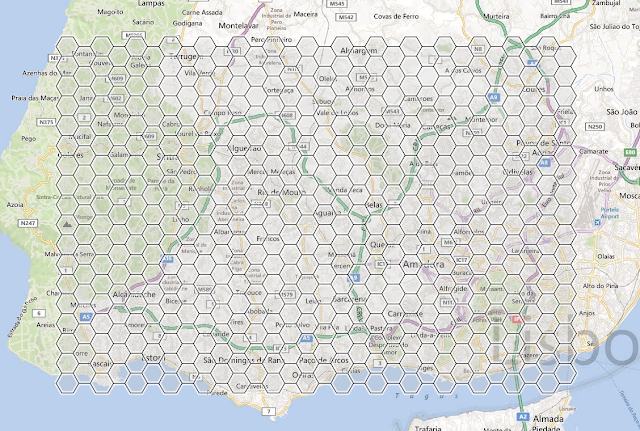
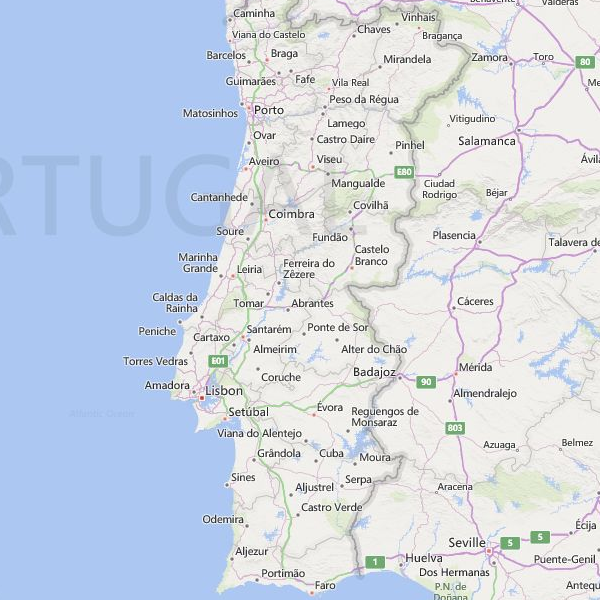
So, I'll begin by editing this example to show the same information set that I used in a previous blog-post, particularly one about using Canvas to display thousands of points in Bing Maps (link).


Basically it contains all the localities of mainland Portugal (about 140.000 points) and should be a nice test for this technology.

The canvas version fared itself quite nicely, but I expect the webgl to perform much better.


Regarding WebGL, and if you're not familiar with it (I'm not an expert myself) you might be a little bit startled by its complexity. WebGL is based on OpenGL ES 2.0, on which you basically have to do "everything" by hand as you've got to program shaders.

It's important to mention that WebGL is only supported on state of the art browsers, hence IE does not support it (not even IE 10). Anyway, if you're reading my blog you're certainly a person of good taste, and are probably using one of the latest versions of Chrome or Firefox :D.

Disclaimer: This post is not a WebGL tutorial. If you want more info on this technology check this online tutorial.

Now here's what I want to do:
  • Replace the random points with real points loaded from a file (about 140.000 points)
  • Change the points size according to the zoom level 

The google maps toolkit WebGL demo displays thousands of random points inside a square in the United States. If you look at the code you see that the square bounds are:

      x: [40;80]   y: [88, 109]

But those aren't geographic coordinates, so what are they? Well, the points are basically represented in the Spherical Mercator projection used in Google Maps at zoom level zero, which is represented as a 256x256 tile.


To draw my points, which are in WGS84 coordinates, I've got to convert them to the spherical mercator projection, thus using the following function:
var pi_180 = Math.PI / 180.0;
var pi_4 = Math.PI * 4;

function latLongToPixelXY(latitude, longitude) {

var sinLatitude = Math.sin(latitude * pi_180);
var pixelY = (0.5 - Math.log((1 + sinLatitude) /
(1 - sinLatitude)) /(pi_4)) * 256;
var pixelX = ((longitude + 180) / 360) * 256;

var pixel = { x: pixelX, y: pixelY};
return pixel;
}
Then I fill the points buffer. The points should be stored as: [x1 y1 x2 y2 x3 y3 ... ]:
var rawData = new Float32Array(2 * points.length);
for (var i = 0; i < points.length; i++) {
var pixel = latLongToPixelXY(points[i].lat, points[i].lon);
rawData[i * 2] = pixel.x;
rawData[i * 2 + 1] = pixel.y;
}
Now, for the final touch, I'll modify the Vertex shader so that the points size varies according to the zoom level. First of all, add a new attribute called "aPointSize" to the vertex shader and use that value to set the gl_PointSize.
<script id="pointVertexShader" type="x-shader/x-vertex">
attribute vec4 worldCoord;
attribute float aPointSize;

uniform mat4 mapMatrix;

void main() {
// transform world coordinate by matrix uniform variable
gl_Position = mapMatrix * worldCoord;
gl_PointSize = aPointSize;

}
</script>
Now, when creating the shader program, we need to get the attribute:
gl.aPointSize = gl.getAttribLocation(pointProgram, "aPointSize");
Afterwards, each time the zoom level is changed, we need to set this attribute (the formula used for the point size is a little bit "empirical"):
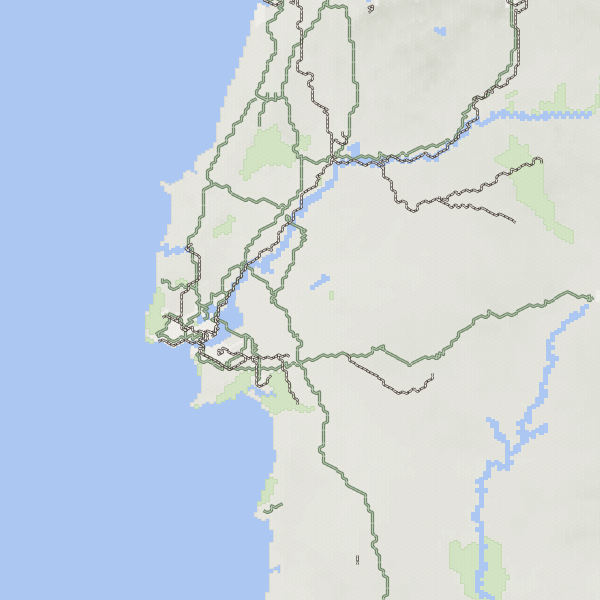
var pointSize = Math.max(currentZoom - 6.0, 1.0);
gl.vertexAttrib1f(gl.aPointSize, pointSize);
And voilá, a map with 140.000 points drawn continuously using WebGL.


You can also view the running demo here.

I'm not particularly impressed with the result as it flickers a little bit with large resolutions. Anyway, WebGL is certainly the future, and I'll probably revisit this demo later to improve it a little bit.

Maps and Boardgames (Part 4 - Creating a simple game)

$
0
0

After several months since part 3 I've decided to pick up my experiments and make a simple game out of them. "Why?" you may ask. Well, mostly because a friend of mine challenged me to, as his company, IBT, is promoting a contest for their core technology: xRTML.  Also, I thought it could be a fun experiment.

xRTML is a technology which allows developers to easily add real-time features to their websites and applications. It works flawlessly and is freaking fast. Hence should be a perfect match for any multiplayer web-based game in real-time, like the one I'm showing here.

So, what's the idea?

I wanted to do something very simple. Basic rules, player opens the browser and immediately starts to play.


URL: http://psousa.net/games/xrtml


  • There are 4 players on a map competing for hexagons, where each one has a set of units (starting with an helicopter, a tank and a shield):


  • You're not limited to the initial set, as you're able to build new units at the base.


  • The game ends when one of the players reaches 1000 points (by conquering hexagons) or the global timer expires.


  • The score mechanism follows the "Samegame" scoring: clusters of  n hexagons are scored as n2, thus promoting big sets of connected hexagons).


Total Points: 3


Total Points: 9

  • The game itself includes a mini-tutorial, so should be easy enough to grasp. Although being simple it should provide some strategic options as you'll have to take into account the unit-type differences:
UnitCooldown TimeOccupation TimeMovement RangeSpecial
Helicopter2 sec6 secs4 hexsFlies over obstacles
Tank4 sec3 secs2 hexsN/A
Shield1 secN/ATeleports to any player occupied hexagon, regardless of rangeCreates an influence radius of 1 hexagon


Architecture:
There's no server-code for this game. Everything runs in the browser + the real-time cloud stuff of xRTML. If you wish to see the full source-code of my game just go ahead and view the source of the web page (the Javascript isn't minified nor obfuscated).

The map:
I've tried different approaches to draw the hexagons (as discussed in previous posts) on a Leaflet map:
  • pre-rendered tiles with TileMill
  • tiles generated on the fly with HTML5 canvas

I eventually opted for the pre-rendered approach as its backwards-compatible with older browsers, although I was pretty satisfied with the client-side version (after several optimizations it now took about 1ms to draw each tile using HTML5 canvas).


Gameplay:
Lots and lots of Javascript. Underscore and jQuery were invaluable. Underscore for all the low-level stuff and jQuery for the DOM manipulation.

Some sections were a little bit more challenging than others. For example:
  • As each type of unit has different movement capabilities: the helicopter flies over obstacles and the tank doesn't, determining the target hexagons, movement rules and occupation logic was an interesting challenge;
  • The shield has an area of influence effect. Creating an algorithm to correctly mix different areas and display them was also fun;
  • Tracking the state of each hexagon and painting them correctly;
  • Calculating the score: lots of Underscore goodness used there;

Anyway, some challenges but technically I'm happy with the result. The performance is pretty nice and I believe it shows that real-time gaming on the web could be a real trend in the future, especially with simple games like this.

Realtime:
I push every action that a player does to the xRTML servers. It automatically delivers everything to whoever is listening. You create a connection, bind to a channel, and just send/receive data. Nice and easy.
Also, xRTML includes some ready-to-use realtime controls, and I've used one of those to add a chat to the game.

The game supports any number of players watching but only 4 playing. Also, I've developed this for Chrome (although it should also work with IE10, Firefox and Safari). You can play it online at:
http://psousa.net/games/xrtml

If you're all alone in there (very likely) you can open a new browser window/tab to simulate other players.

Also, a minor disclaimer: this isn't a "real" game, and I haven't really beta tested it, so it's very likely that the units are not properly balanced and some players have an unfair advantage over others :)

Cocos2d-html5 (Part 1 - Introduction)

$
0
0
Hi there,

In this series of posts I'm going to show how to use the html5 version of the popular cocos2d framework, called "cocos2d-html5".

I'll use version 2.1.1, which has now feature parity between most variants, namely: cocos2d, cocos2d-x and cocos2d-html5. In this particular post I'm just going to setup everything in Windows 8 and prepare the placeholder for future posts.


You should check the homepage for this project at: http://www.cocos2d-html5.org. It includes some info, tutorials and download links.

You may opt to download the cutting-edge version from the github repository or one of the stable(ish) releases.


  • For this tutorial I'll use the github version. You can clone the repository or download the zip, but I recommend the first option, as it'll also download the related projects (namely the samples).

Don't worry if you've never used Git before. The GitHub Windows client is as simple as it gets, and with literally one-click setups the project on disk.


  • You need to setup a web-server to fully use Cocos2d-html5. As I'm mostly a Windows developer  I'm going to use IIS 8 for it.


  • Under Default Web Site create a new Application called "cocos2dhtml5", pointing it to the repository on the disk (probably in: "c:\Users\<Your user>\Documents\GitHub\cocos2d-html5")


  • Open a Browser window and point it at: "http://localhost/cocos2dhtml5/index.html".
  • In windows 7/8 it's likely that you'll get an HTTP 401.3 Error

    • If so, you need to add the IUSR and IIS_IUSRS groups in the security settings of the folder. 

  • You should now be able to see the starting page of cocos2d-html5.

  • You can explore the demos to really understand the capabilities of cocos2d-html5. Unfortunately, if you open the tests, you can see that some of them don't work. If you inspect the HTTP traffic you see lots of 404 over there. Basically IIS is not recognizing most of the extensions used (as they're not standard): fnt, plist, ccbi, pfx, etc.
  • Fortunately, since IIS 7, we can define additional mime-types through web.config. Thus, create a "web.config" file in the root of the repository with the following content:
<?xml version="1.0" encoding="UTF-8"?>
<configuration>
<system.webServer>
<staticContent>
<mimeMap fileExtension=".plist" mimeType="text/xml" />
<mimeMap fileExtension=".tmx" mimeType="text/xml" />
<mimeMap fileExtension=".tsx" mimeType="text/xml" />
<mimeMap fileExtension=".ccb" mimeType="text/xml" />
<mimeMap fileExtension=".bgm" mimeType="text/xml" />
<mimeMap fileExtension=".ccbi" mimeType="text/xml" />
<mimeMap fileExtension=".fnt" mimeType="text/plain" />
</staticContent>
</system.webServer>
</configuration>
  • Refresh the webpage. You should now be able to view the remaining samples. 

  • It's very common to use the "Hello World" demo as a placeholder for your project, so just open it. You should see something like this:
  • Copy the "HelloHTML5World" folder in file explorer, naming the new folder MyFirstGame (or whatever you prefer).

  • Now take a look at the structure of the new project

In this post I'm not going to delve into great detail, but the flow is basically:

    • "index.html" is the webpage where all starts. It: 
      • Declares an HTML5 canvas
      • References the file: "cocos2d.js"
    • "cocos2d.js" is the main configuration of the engine. It:
      • Is used to configure certain settings of the engine
      • References all the JS files used in the project
      • Bootstrapps everything, launching your application, in this case "MyApp.js"
    • "MyApp.js" is your application itself. In the Hello World template it already has a scene setup up, several animations and some event handlers. I've removed most code so that it looks like this:
var Helloworld = cc.Layer.extend({

helloLabel: null,

init:function () {
var selfPointer = this;
this._super();

var size = cc.Director.getInstance().getWinSize();

var layerBackground = cc.LayerColor.create(
new cc.Color4B(0, 0, 0, 255), 800, 600);

this.helloLabel = cc.LabelTTF.create("My First Game", "Arial", 38);
this.helloLabel.setPosition(cc.p(size.width / 2, 500));
layerBackground.addChild(this.helloLabel);
this.addChild(layerBackground);
return true;
}
});

var HelloWorldScene = cc.Scene.extend({
onEnter:function () {
this._super();
var layer = new Helloworld();
layer.init();
this.addChild(layer);
}
});

It's just a black background with some text on it.


I've also uploaded so you can see it in "motion" here. Not really interesting, but a placeholder nonetheless.

Creating a Bing Maps Canvas TileLayer (Part 1 - Introduction)

$
0
0
Part 1 - Introduction
Part 2 - Bing Maps Module

I've already done some experiments with Canvas on Bing Maps. You can check the blog post here and the end-result here.

The approach that I've shown in that post uses a single canvas on top of the map and updates it every time the map view changes. This allows for some really funky results, but it's a tad intensive on the CPU and sometimes that just goes to waste if there's no change on the data or its representation.

What I would like is the ability to do something like I've done previously with Leaflet: creating a client-side canvas tile layer. Thus, the tiles would be created dynamically and Bing Maps would treat them as regular images, leveraging all its goodness regarding panning, zooming and such.


I've actually managed to do it in a really, really simple way:
  • Creating a TileSource in Bing Maps that uses a custom UriConstructor
  • Creating a TileLayer with that TileSource
  • The Custom UriConstructor, instead of using a server-url, returns a Data-Uri, built using Canvas
That might seem a little bit confusing, so let me show you the full skeleton of this implementation:
<!DOCTYPE html PUBLIC "-//W3C//DTD XHTML 1.0 Transitional//EN" 
"http://www.w3.org/TR/xhtml1/DTD/xhtml1-transitional.dtd">
<html>
<head>
<title>Bing Maps Canvas Layer</title>
<meta http-equiv="Content-Type" content="text/html; charset=utf-8"/>
</head>
<body onload="loadMap();">

<div id='mapDiv' style="width:100%; height: 100%;"></div>
<canvas id="tileCanvas" width="256px" height="256px"></canvas>

<script type="text/javascript"
src="http://ecn.dev.virtualearth.net/mapcontrol/mapcontrol.ashx?v=7.0">
</script>
<script type="text/javascript">
function loadMap()
{
MM = Microsoft.Maps;
var map = new MM.Map(document.getElementById("mapDiv"), {
center: new Microsoft.Maps.Location(55, 20),
mapTypeId: Microsoft.Maps.MapTypeId.road,
zoom: 4,
credentials:"YOUR CREDENTIALS HERE"});

var tileSource = new MM.TileSource({uriConstructor: getTilePath});
var canvasTilelayer= new MM.TileLayer({ mercator: tileSource});
map.entities.push(canvasTilelayer);
}

function getTilePath(tile) {
var canvas = document.getElementById('tileCanvas');
var context = canvas.getContext('2d');
context.clearRect (0,0, 256, 256);
drawTile(context, tile);
return canvas.toDataURL();
}

function drawTile(context, tile) {
//use the canvas context to draw stuff...
}
</script>
</body>
</html>
Yep, as simple as that. Let me explain it a little bit better. Bing Maps has a class called TileLayer which provides the ability to overlay additional layers on top of the map. It's typically used like this (example from the above link):
 // Create the tile layer source
var tileSource = new Microsoft.Maps.TileSource({uriConstructor:
'http://www.microsoft.com/maps/isdk/ajax/layers/lidar/{quadkey}.png'});

// Construct the layer using the tile source
var tilelayer= new Microsoft.Maps.TileLayer({ mercator: tileSource, opacity: .7 });

// Push the tile layer to the map
map.entities.push(tilelayer);
You create a TileSource, which is typically an URL with a placeholder for the tile identification, and pass it to a TileLayer which is then added to the map.

What some people don't know is that the "uriConstructor" of TileSource may in fact be a function, and each tile may have a custom programmatic URL. For example, to load Google Maps compatible tiles in Bing Maps (instead of using the quadkey) one could change the above example to:
 // Create the tile layer source
var tileSource = new Microsoft.Maps.TileSource({uriConstructor: getTilePath});

// Construct the layer using the tile source (remains unchanged)
var tilelayer= new Microsoft.Maps.TileLayer({ mercator: tileSource, opacity: .7 });

// Push the tile layer to the map
map.entities.push(tilelayer);

function getTilePath(tile) {
//Assuming the tiles exist as "http://somedain/{z}/{x}/{y}.png"
return "http://somedomain/" + tile.levelOfDetail + "/" + tile.x + "/" + tile.y + ".png";

}
Now, I want to create an image dynamically in client-side inside "getTilePath" and return a local URL to it. For that I'm using something called a Data URI Scheme. It basically allows one to include data in-line as if it was loaded from an external source associated with an URI. For example, an image may be declared in HTML as:
<img src="data:image/png;base64,iVBORw0KGgoAAAANSUhEUgAAAAUA
AAAFCAYAAACNbyblAAAAHElEQVQI12P4//8/w38GIAXDIBKE0DHxgljNBAAO
9TXL0Y4OHwAAAABJRU5ErkJggg==" alt="Red dot">

The final piece of the puzzle is generating this kind of URI scheme on the fly. Fortunately canvas already provides support for that and you just need to call the "Canvas.toDataURL" function to get a working URI
Ok, let me change the "drawTile" to display something. For each tile I'll show a square with the Z/X/Y of it.
function drawTile(context, tile) {

var tileDescription = "(" + tile.levelOfDetail + ", "
+ tile.x + ", "
+ tile.y + ")";

context.font = "bold 18px Arial";
context.fillStyle = "navy";
context.textAlign = 'center';
context.fillText(tileDescription, 128, 128);

context.setLineDash([5,2]);
context.strokeRect(0,0,256,266);
}


Online demo here

Obviously you wouldn't need Canvas for something as simple as drawing squares and text. Let's make something a little bit more interesting, like creating some fancy canvas based pushpins (with a gradient, shadow and a dynamic text). So, assuming an array of points declared as:
var points = [
{ lat: 40.723697, lon: -8.468368 },
{ lat: 37.829701, lon: -7.943891 },
{ lat: 41.552968, lon: -8.309867 },
{ lat: 41.509392, lon: -6.859326 },
{ lat: 39.946475, lon: -7.50164 },
{ lat: 40.204391, lon: -8.33593 },
{ lat: 38.603914, lon: -7.841794 },
{ lat: 37.243653, lon: -8.131754 },
{ lat: 40.641346, lon: -7.229598 },
{ lat: 39.717187, lon: -8.775258 },
{ lat: 38.998077, lon: -9.163589 },
{ lat: 39.190066, lon: -7.620413 },
{ lat: 41.224799, lon: -8.352842 },
{ lat: 39.293463, lon: -8.477529 },
{ lat: 38.318513, lon: -8.653012 },
{ lat: 41.877865, lon: -8.507078 },
{ lat: 41.555004, lon: -7.631723 },
{ lat: 40.798902, lon: -7.870874 }];
The drawTile function could then be something like:
function drawTile(context, tile) {

var z = tile.levelOfDetail;
var x = tile.x;
var y = tile.y;

//Get the mercator tile coordinates
var tilePixelX = x * 256;
var tilePixelY = y * 256;

var radius = 15;

for (var i = 0; i < points.length; i++) {

// get pixel coordinate
var p = latLongToPixelXY(points[i].lat, points[i].lon, z);

// canvas pixel coordinates
var x = (p.x - tilePixelX) | 0;
var y = (p.y - tilePixelY) | 0;

// Circle
context.beginPath();
context.arc(x, y, radius, 0, 2 * Math.PI, false);

// Fill (Gradient)
var grd = context.createRadialGradient(x, y, 5, x, y, radius);
grd.addColorStop(0, "#8ED6FF");
grd.addColorStop(1, "#004CB3");
context.fillStyle = grd;

// Shadow
context.shadowColor = "#666666";
context.shadowBlur = 5;
context.shadowOffsetX = 7;
context.shadowOffsetY = 7;
context.fill()

context.lineWidth = 2;
context.strokeStyle = "black";
context.stroke();

// Text
context.lineWidth = 1;
context.fillStyle = "#000000";
context.lineStyle = "#000000";
context.font = "12px sans-serif";
context.textAlign = "center";
context.textBaseline = "middle";
context.fillText(i + 1, x, y);

}
}

Voilá. 18 points corresponding to the Portuguese Continental Districts.

Online demo here

This could be optimized as each tile is looking at all the points instead of just the ones inside its bounds. Anyway, just talking about 18 points here so not that important.

Now, what are the caveats of using this approach?
  •  Being Canvas based you don't have out-of-the box support from IE < 9 (although you can use something like excanvas to add canvas support)
  • The Data URI Scheme has supposedly some limitations in IE < 9 (haven't tried it)
  • The generated tiles are not cached by the browser, thus being regenerated each time Bing Maps requests the tiles (but I'll address this in a second)
Caching tiles

If you want to cache the images you need to use a Javascript library for that, like JsCache. It provides a simple LRU mechanism that also uses Local Storage if supported by the Browser.

Quick and dirty implementation. After importing the JS file declare the js cache:
var cache = new Cache();
Now, instead of generating the tile try to fetch it from cache. Thus, our "drawTile" function will be unchanged  but "getTilePath" will become:
function getTilePath(tile) {
var tileKey = tile.levelOfDetail + "_" + tile.x + "_" + tile.y;

var dataUrl = cache.getItem(tileKey);

if(dataUrl == undefined) {
var canvas = document.getElementById('tileCanvas');
var context = canvas.getContext('2d');
context.clearRect (0,0, 256, 256);
drawTile(context, tile);
dataUrl = canvas.toDataURL();
cache.setItem(tileKey, dataUrl);
}

return dataUrl;
}

Online demo here

For this particular demo the performance improvement is not that great, but could make a lot of difference in more complex scenarios.


In my next post I'm going to tweak this code a little bit, create a Bing Maps Module out of it, including these and other examples.

Creating a Bing Maps Canvas TileLayer (Part 2 - Bing Maps Module)

$
0
0
Part 1 - Introduction
Part 2 - Bing Maps Module

In my previous post I've developed a working Canvas TileLayer for Bing Maps. Since then I've enhanced that code and packaged it inside a working Bing Maps Module, adding some new features in the process.
This post is going to be very "demo driven", and I'll show how to use the module with all of its variants. All the demos in this post are included with the module package.

Note: If you want to read a little bit more about Bing Maps Modules you should check http://bingmapsv7modules.codeplex.com, which also includes a catalog for several modules out there.

Update 20/04/2013
This module has been added to the bingmapsv7modules project: https://bingmapsv7modules.codeplex.com/wikipage?title=Canvas Tile Layer Module


Basic usage:

As any other module, you should register and load it. This is done after loading the map and the boilerplate code is like this:
        var MM = Microsoft.Maps;
var map = new MM.Map(document.getElementById("mapDiv"), {
credentials:"MAP CREDENTIALS HERE"});

MM.registerModule("CanvasTileLayerModule", "js/CanvasTileLayerModule.js");
MM.loadModule("CanvasTileLayerModule", {
callback: function () {
new CanvasTileLayer(map,
{
drawTile: function(canvasContext, tile) {

//CANVAS DRAWING HERE
}
});
}});
The module is registered and loaded. Then, after being loaded, a CanvasTileLayer is created by passing the map itself as an argument and some additional options. The only mandatory property is the "drawTile", which is where all the custom tile drawing will occur.

Let me show a simple example. I'll draw a smiley face on the center of each tile. So, I'll basically fill the custom drawing section with this code (taken from: http://talkaboutstuff.hubpages.com/hub/HTML5-Canvas-Creating-a-smiley-face-with-the-ARC-API)

// The Face
context.strokeStyle = '#0000FF';
context.fillStyle = '#FFFF00';
context.lineWidth = 4;
context.beginPath();
context.arc(120,120,50,0*Math.PI,2*Math.PI,true);
context.closePath();
context.stroke();
context.fill();

// The Smile
context.strokeStyle = '#FF0000';
context.lineWidth = 2;
context.beginPath();
context.arc(120,110,40,0.2*Math.PI,0.8*Math.PI,false);
context.stroke();

// The Left eye
context.strokeStyle = '#000000';
context.fillStyle = '#000000';
context.beginPath();
context.arc(100,105,10,0*Math.PI,2*Math.PI,false);
context.closePath();
context.stroke();
context.fill();

// The Right Eye
context.strokeStyle = '#000000';
context.fillStyle = '#000000';
context.beginPath();
context.arc(140,105,10,0*Math.PI,2*Math.PI,false);
context.closePath();
context.stroke();
context.fill();


Online demo


Debug Mode

Besides the drawing callback ("drawTile" parameter) the module also supports a "debugMode" property. Let's try it on the previous example.

var MM = Microsoft.Maps;
var map = new MM.Map(document.getElementById("mapDiv"), {
credentials:"MAP CREDENTIALS HERE"});

MM.registerModule("CanvasTileLayerModule", "js/CanvasTileLayerModule.js");
MM.loadModule("CanvasTileLayerModule", {
callback: function () {
new CanvasTileLayer(map, {
debugMode: true,
drawTile: function(canvasContext, tile) {

//(...)
}
});
}});


Online Demo

When turned on (it's off by default) shows each tile boundary and some additional info like its z/x/y, the time it took to render, and when the tile was generated (useful for caching purposes).  Should be pretty helpful during development.


Drawing Georeferenced Data

So, drawing ungeoreferenced data (like the smiley above) is nice and all, but limited to a certain range of scenarios (like drawing watermarks, grids and stuff). For the georeferenced data we've got to make some calculations to determine the position, relative to the tile canvas, were to draw. Thus, I've included in the callback a little bonus: a "tile object". It includes some properties and functions that should help in the drawing process:
  • x: the tile x index
  • y: the tile y index
  • z: the tile level of detail, or z index
  • pixelCoordinates:  the pixel coordinates (not viewport based) of the top level coordinate of the tile
  • getLocationPixelOffset(location): function that converts real coordinates to canvas coordinates.
  • metersPerPixel: current resolution of the tile in meters per pixel

For this example I'll use a sample data of 150 coordinates in Portugal and I'll draw a small square for each coordinate on the map. The drawTile function will be:
    drawTile: function(context, tile) {
for (var i = 0; i < sampleData.length; i++) {

//where all the magic exists
var canvasPixel = tile.getLocationPixelOffset(sampleData[i]);

var squareSize = 10; //in pixels

//(optional, just to improve performance)
// don't draw coordinates outside of the tile,
// taking into account the square size
if(canvasPixel.x < 0 - (squareSize / 2) ||
canvasPixel.x > 256 + (squareSize / 2) ||
canvasPixel.y < 0 - (squareSize / 2) ||
canvasPixel.y > 256 + (squareSize / 2)) {
continue;
}

context.fillStyle = "red";
context.fillRect(canvasPixel.x, canvasPixel.y, squareSize, squareSize);
}

Online Demo


Caching

I've also included a "useCache" parameter when building the Canvas Tile Layer. It's off by default because it depends on jscache. Thus, if you turn on this parameter, you need to include it in your page (its a small .js file, with MIT license). Anyway, if you can, always use the cache option because the generated tiles are not cached by the browser. The cache parameters are:
  • cacheTiles: bool (false, by default)
  • cacheTimeout: int (60 seconds, by default) - The amount of seconds for a cache item to expire. Note: this cache uses a sliding window, so each time a tile is fetched the cache timer is reset.
To use it declare the options like this:

var MM = Microsoft.Maps;
var map = new MM.Map(document.getElementById("mapDiv"), {
credentials:"MAP CREDENTIALS HERE"});

MM.registerModule("CanvasTileLayerModule", "js/CanvasTileLayerModule.js");
MM.loadModule("CanvasTileLayerModule", {
callback: function () {
new CanvasTileLayer(map, {
cacheTiles: true,
cacheTimeout: 300,
drawTile: function(canvasContext, tile) {

//(...)
}
});
}});
Then use the debug mode to confirm that the tiles are indeed being fetched from cache and not regenerated on the fly.


Additional Demos
The following demos are not related to any specific feature of the module and are just included as a proof-of-concept.

Demo #1: Basic Clustering

This demo uses a simple clustering technique were each tile is segmented into 16 squares and each one shows a different color and number to represent the amount of coordinates inside it. Better shown than said, this is the cluster for the same sample data of the previous example.


Online Demo


Additional Demo #2: Heatmap

Also with the same sample data, this module can be used for more complex stuff, like a heatmap.

Disclaimer: the Heatmap drawing code was taken from the Client Side Heatmap Module from Alastair Aitchison. All credits go to him.


Online Demo


You can download the module and all its demos here.

Converting from Leaflet to Bing Maps

$
0
0
A few months ago I developed a map-based game for a contest. It was a simple multiplayer wargame on which 4 players could try to conquer Europe using a bunch of different units.


For the mapping API I had to decide between Bing Maps and Leaflet. At the time, as I expected to have to use Canvas to draw the hexagons (which Leaflet supports with canvas tile-layers) I chose Leaflet.

I've now decided to pick-up this game and evolve it into something more "tangible". Thus, and although Leaflet has nothing wrong by itself, it's "just" a map api. I need something more complete and so I've decided to port the game to Bing Maps. Afterwards I'll improve it with some really cool ideas that I have. This blog post should be more or less a catalog of the changes I had to make to convert this game from Leaflet to Bing Maps.


First of all let me start by showing you both versions:
They should behave quite similarly performance-wise although the inertia feeling with Bing Maps is top-notch and hard to beat.

The game includes a tutorial and should be easy enough to grasp. Just open two or more tabs on the browser to simulate different players (I've tested it in Chrome and IE 10)

The map itself looks like this:


Basically all that image (except those 4 colored hexagons) is composed of server-tiles generated by me (using C# to create the hexagons and TileMill to design/generate the tiles).
  • Loading the map without base images
Leaflet, as it doesn't provide data by itself, doesn't show any tiles by default. As I want to have my own base images the Bing Map should be loaded with the following attribute:
mapTypeId: Microsoft.Maps.MapTypeId.mercator

That one was easy :)

  • Limiting the Zoom Levels
Now this was slightly more tricky. I only generated tiles for zoom levels between 6 and 8, mostly because the game wouldn't be very playable outside these levels, as the units would be too small/large to be controlled properly.

In leaflet you just pass a "maxzoom" and "minzoom" attributes to the map constructor and you're set. With Bing one needs to be more creative, namely handling the "viewchangestart" to prevent crossing the zoom boundaries, like this:
MM.Events.addHandler(gameData.map,'viewchangestart',function () {
if (gameData.map.getZoom() <= gameData.map.getZoomRange().min) {
gameData.map.setView({
'zoom': gameData.map.getZoomRange().min,
'animate': false
});
}
else if (gameData.map.getZoom() >= gameData.map.getZoomRange().max) {
gameData.map.setView({
'zoom': gameData.map.getZoomRange().max,
'animate': false
});
}
});
  • Loading the hexagons tile-layer
Another interesting detail about the generated tiles is that they're in zxy format, particularly in TMS format. Bing Maps uses quadkeys by default to identity the tiles, which is a pretty different beast. Fortunately the Bing Maps developers were kind enough to provide lots of extensibility points in the API, thus making possible to do some code like this (which I blatantly stole from an Alastair Aitchison post):
var tileSource = new MM.TileSource({ 
uriConstructor: function getTilePath(tile) {
var x = tile.x;
var z = tile.levelOfDetail;
var yMax = 1 << z;
var y = yMax - tile.y - 1;

return "Images/Tiles/BaseMap4/" + z + "/" + x + "/" + y + ".png";
}});
var tileLayer = new MM.TileLayer({ mercator: tileSource, opacity: 1 });

Basically one has to define a TileSource with an implementation on how to build the tile's urls. Seems complex but it's a pretty robust mechanism.
  • Image Overlays
Those 4 colored hexagons are not in the base maps, nor are pushpins. They're actually image overlays which blend seamlessly with the base map.


Bing Maps doesn't support this out-of-the-box but fortunately Ricky has created a brilliant Bing Maps module that does exactly that. So:

Leaflet code:
var overlay = L.imageOverlay('Images/Units/base_p' + (i+1) + '.png',
[[maxLat, minLon], [minLat, maxLon]])
.addTo(gameData.map);

Bing Maps code (after loading the module):
var imageRect = MM.LocationRect.fromCorners(
new MM.Location(maxLat, minLon), new MM.Location(minLat, maxLon));
var overlay = ImageOverlay(gameData.map,
'Images/Units/base_p' + (i+1) + '.png', imageRect));
  • Handling Events on units
Event-handling is one of the most tricky parts in this game. Lots of events are handled on the units depending on their current state:
    • click
    • dragstart
    • drag
    • dragend
The APIs differ a little bit on this but are similar enough (the event names are actually the same). Leaflet uses a "fluent" like syntax and Bing Maps a more conventional approach, but both work similarly:

Leaflet:
var marker = L.marker(hexagon.center, {...})
.on('dragstart', function(e) {...})
.on('drag', function(e) {...})
.on('dragend', function(e) {...})

Bing Maps:
MM.Events.addHandler(pushpin, 'dragstart', function(e){...});
MM.Events.addHandler(pushpin, 'drag', function(e){...});
MM.Events.addHandler(pushpin, 'dragend', function(e){...});

What was a little bit more cumbersome is removing event handlers from pushpins. The "removeHandler" function receives the "handler ID", which isn't typically that practical to hold. I implemented a workaround using a "private" field from the Pushpin object:
if(MM.Events.hasHandler(pushpin, 'click')) {
MM.Events.removeHandler(marker.mm$events.click[0]);
}
I'm not terrible happy with that solution but it does work fine.
  • PolygonCollection vs EntityCollection
Well, in Leaflet there's a PolygonCollection and in BingMaps an EntityCollection. They're pretty similar and were, by far, the easiest objects to convert from Leaflet to Bing Maps.

  • HTML Content in Markers/Pushpins
I use HTML content for the descriptive dynamic text around the bases.


Both Leaflet and Bing Maps support HTML content in the pushpins. Here's how they're declared (I've omitted the non-relevant fields):

Leaflet:
var info = L.divIcon({
className: 'base-text',
html: html,
iconSize: [150, 50],
iconAnchor: [150, 0],
});

Bing Maps:
var info = {
htmlContent: html,
anchor: new MM.Point( 150, 0),
width: 150,
height: 50,
typeName: 'base-text'
};

The "className"/"typeName" attributes map to a css class that should be defined in your styles file.

  • Modifying Units Opacity
When a unit has been moved it passes through a cool-down time on which it has to wait before moving again. During this small period the unit is displayed as transparent.

In Leaflet this is done directly with a .setOpacity function. With Bing Maps this is done by changing the css class of the element:
marker.setOptions({typeName: 'unit-disabled'});
And on the css file:
.unit-disabled { opacity: 0.25; }

  • Other notable differences
Handling polylines, polygons, coordinates, colors is also pretty different. Just look at the code as it should be pretty self-explanatory. It's neither minified nor obfuscated (and also not polished :D).


To be continued...

Basically both APIs have chosen a different approach on most stuff, making the conversion non-trivial for more complex scenarios (like this one). Anyway, I'm making the Bing Maps version the "official" one, and anxious to start implementing my new ideas.

Bing Maps Module: InfoboxAutoPan

$
0
0
I've just created a very, very simple Bing Maps module. I'll jump ahead to the demo before any explanation.

Demo:  http://psousa.net/demos/bingmaps/infoBoxAutoPanModule/simpleExample.html

Basically there are two maps, both with a pushpin near the edge and a click handler to display an infobox.


After clicking the pushpins this is the end-result:


The first one shows the default behavior: the infobox is displayed, although outside the map boundaries.
The second one, using my module, pans the map so that the infobox is fully visible.

Usage:
Using this module is incredibly simple. Just load it as usual and run the InitInfoboxAutoPanModule command:
MM.registerModule("InfoboxAutoPanModule", "js/InfoboxAutoPanModule.js");
MM.loadModule("InfoboxAutoPanModule", { callback: function () {
InitInfoboxAutoPanModule(map);

//Rest of the code
});

Then, just create an infobox, using the typical infobox.setOptions({visible: true}) to display it.

Now, here's the detail: I've created an additional parameter called "autoPan". Just add it to the previous command and the map should automatically pan if required:
infobox.setOptions({visible: true, autoPan: true});

And that's mostly it :)

I've also added an optional argument to the module initialization which allows the margin to the edge to be configured (default: 5x5). Thus, if for instance the module would be initialized as:
InitInfoboxAutoPanModule(map,{horizontalPadding:50, verticalPadding:20});

The end-result after panning would be:


 Implementation:

The implementation is also simple. I just copy the original setOptions function to a new field inside the infobox and redefine setOptions to include some extra code. Basically it's just an hook on the existing function:
this._oldSetOptions(arguments);

if(arguments.autoPan == true && arguments.visible == true) {

var infobox = this;
var mapWidth = _map.getWidth();
var mapHeight = _map.getHeight();
var point = _map.tryLocationToPixel(infobox.getLocation());
var remainderX = (mapWidth / 2) - point.x;
var remainderY = (mapHeight / 2) + point.y;

//Empirical values based on the current infobox implementation
var xExtraOffset = 33;
var yExtraOffset = 37;

var pixelsOutsideX = infobox.getWidth() +
infobox.getOffset().x - remainderX - xExtraOffset +
_options.horizontalPadding;

var pixelsOutsideY = infobox.getHeight() +
infobox.getOffset().y + yExtraOffset - remainderY +
_options.verticalPadding;

var newPoint = new Microsoft.Maps.Point(0, 0);

if (pixelsOutsideX > 0) {
newPoint.x += pixelsOutsideX;
}

if (pixelsOutsideY > 0) {
newPoint.y -= pixelsOutsideY;
}

var newLocation = _map.tryPixelToLocation(newPoint);

_map.setView({
center: new MM.Location(newLocation.latitude, newLocation.longitude)
});
}

Enjoy.

Dynamically creating hexagons from real-word data (Part 1 - Roads)

$
0
0
As I mentioned in one of my previous posts I have some cool ideas that I would really like to try out. One of them involves creating hex-based battlegrounds dynamically around the world.

So, one would pick a region and that particular area would be overlaid with hexagons that represent real world-data like rivers, roads, forests, mountains, etc. All of this on top of Bing Maps.

It's not very easy to explain my goal so let me use the boardgame Memoir'44 as an example. Here's an actual map from that game.


Now suppose all of this was generated dynamically based on a real map, which would contain a road and some forests.

This is not an easy task and I'll break this into pieces (pun intended). On this first post I'll just address road creation.


To begin with I'm going to simplify the problem. I'll just pick two highways near my home-town: A5 and A16.


Step 1: Display hexagons on top of the map.

Using my own Canvas Tile Layer module, I've generated a layer of hexagons on top of the target map.


I just had to adapt some of my "old" hexagon drawing code.

Step 2: Get the data that represent the highways

Although I'll eventually read this information from some data-services or DB with OpenStreetMaps information for now I've just manually imputed both polylines. This is the end-result.


Step 3: Calculate intersection with the hexagons.

Now, for each hexagon, calculate the edges that intersect with the roads.


Step 4: Draw first version of road hexagons

The road hexagons must follow a couple of rules, otherwise they won't be able to fit together, namely:

  • The roads must enter the hexagons in the center of the edge

  • The road must start/end perpendicular to the edge


Thus, taking into account those rules, here's the first version of the road (hiding the base road lines):


Step 5: Improve the road representation

Adding a border and some stripes greatly improves the road representation:


This isn't as simple as it probably seems from this post. There were a couple of really interesting challenges that I had to address. Anyway, you can view the source-code yourself in the end result.

On my next post I'll try to represent additional concepts like rivers and forests.


Dynamically creating hexagons from real-word data (Part 2 - Railroads and Forests)

$
0
0
Part 1 - Roads
Part 2 - Railroads and Forests

In this post I'm going to add two new concepts to the hexagon representation: railroads and forests. Also, instead of having the data hardcoded, I'm going to load it from GeoJSON files. Eventually I'll change this behavior to have the data being served by a service, but for now static files will do.

Let me use another image of the wargame Memoir'44 as an example of what I'm trying to achieve, which includes railroads and forests.


Obviously I'm not targeting (for now) this degree of presentation. I just want to detect the underlying objects and represent them differently.

First of all, loading from a GeoJSON is pretty straightforward. To load all the railroad segments the code will be something like this (using Underscore)
_.each(geojsonData.features, function(val) {
var railroad = val.geometry.coordinates;
for(var i=0; i < railroad.length - 1; i++) {

//Get points of both vertices of edge
var p0_x = railroad[i][0];
var p0_y = railroad[i][1];

var p1_x = railroad[i+1][0];
var p1_y = railroad[i+1][1];
}
Now, creating railroads is pretty much similar to the roads from the previous post. The main difference will be cosmetic.

The road hexagons were represented like this:


And the railroad hexagons like this:


Drawing forest hexagons requires a different approach as they're represented by Polygons instead of Polylines. After several iterations and experiments I ended up with a really simple and fast algorithm that provides nice results: to decide if an hexagon is a forest hexagon or not I just pick its center and check if it's inside the forest polygons.


So, instead of calculating if two polygons intersect and then deciding if that hexagon should be included or not, this is a simple "point inside polygon" validation.

For now, I'm just representing these hexagons with a solid green background.


Drawing everything together, this is the result so-far.

As usual, you can take a look at everything "in motion":
Demo Page

Still lots to do, namely:
  • Implement boundaries and water
  • Add some real units to the map (like tanks and helicopters) and apply terrain restrictions to the movement.
  • Instead of loading static GeoJSON files load the info from a service dynamically
  • Improve the presentation of the hexagons
  • And much more...


Dynamically creating hexagons from real-world data (Part 3 - Data-Services)

$
0
0

In this iteration of my experiment I've add a services layer that is able to fetch real world-info in GeoJSON format, instead of having it hard-coded as on the previous post.

Also, I've added a small degree of interaction on the hexagon board creation, as the user is now able to choose where the board will be created. Nothing too fancy though.

As a finishing touch I've also improved the overall appearance of the hexagons. The following image shows the end-result.


The idea

Purely from an end-result point-of-view this post doesn't seem to be very ambitious over the previous ones. The base change is that instead of having an hexagon board immediately created on load it allows the user to specify where it should be created.


Steps

The truth is that there's lots of plumbing behind the scenes. Long-story short, these are the steps that lead up to this:
  • Created a SQL 2012 Database to store the spatial data

  • Developed a small application that is able to load/parse data from Shapefiles and store it in the database.
  • Created a REST Service that is able to return the spatial data in GeoJSON format


  • The data-access is done using Entity Framework 6 and I'm using NetTopologySuite to generate the GeoJson.


Currently the main action looks like this:
public ContentResult Features(
string featureType,
double north,
double south,
double east,
double west,
double tolerance)
{
var wktReader = new WKTReader();
var boundingBox = GeoUtil.GetBoundingBox(north, west, south, east);
using (var context = new RealHexagonsContext())
{

var geometries =
new Collection<Feature>(
context.Features
.Where(f => f.Type == featureType)
.Where(f => SqlSpatialFunctions
.MakeValid(f.Geo)
.Intersects(boundingBox))
.Select(f => new {
f.Name,
f.Type, f.SubType,
Geo = SqlSpatialFunctions
.MakeValid(SqlSpatialFunctions
.Reduce(f.Geo, tolerance)) })
.ToList()
.Select(feature =>
{
var attributes = new AttributesTable();
attributes.AddAttribute("name", feature.Name);
attributes.AddAttribute("type", feature.Type);
attributes.AddAttribute("subtype", feature.SubType);
return new Feature(
wktReader.Read(feature.Geo.AsText()),
attributes);
})
.ToList());

var featureCollection = new FeatureCollection(geometries);

var writer = new GeoJsonWriter();

string result = writer.Write(featureCollection);

return Content(result, "application/json");
}
}

It returns all the features of a certain type inside a bounding-box (defined by the corners of the viewport) in GeoJson.
  • Modified the web-client to support this service
I used jQuery to make some ajax calls and underscore to iterate the collections. The remaining logic is mostly similar to what I did on my previous post, although some bugs were fixed.
  • Added a small degree of interaction to the website.
Created an overlay on the map with a rectangle and two buttons, one to create the hexagon area and one to remove it.


  • Improved the cosmetic of the hexagons a little bit.
    Most of the area hexagons are now using some textures, as seen in this picture. Nothing spectacular though :).


    In Motion

    As I haven't deployed this yet, here's a short video showing the end-result.


    Ending remarks

    Everything is still being done on client-side, using my own Canvas TileLayer Module. As I mentioned on the video, I'll eventually push some of these calculations to server-side and cache/store the results to speed-up the whole map.

    Also, I'm not really expecting to create a part 4 of this series. I do plan to use this approach for an interesting project I've got on my backlog. Stay tuned ;)


    UTFGrid in Bing Maps

    $
    0
    0
    Part 1 - Introduction
    Part 2 -Bing Maps Module

    UTFGrid is a technology that provides the ability to have client-side interaction over raster map-tiles. Everything is very well explained in this page (which includes a working example), but the idea is simply to have an accompanying JSON file for each map-tile containing meta-information about that image. This info is also very fast to handle in client-side.

    For instance, assuming this raster tile which contains Great-Britain:


    The accompanying UTFGrid file will have something that looks like an ASCII-Art representation of the image (albeit a little bit stretched):


    !!!! !! !!!!!!!!!!!!!!!!!!!
    !!! !!! !!!!!!!!!!!!!!!!!!!
    ! !!!!! !!!!!!!!!!!!!!!!!!!
    !! !! !!!!!!!!!!!!!!!!!!!
    ## !! !!!!!!!!!!!!!!!!!!!
    ##### !!! ! !!!!!!!!!!!!!!!!!!!!
    ########!!!!! !!!!!!!!!!!!!!!!!!!!
    #######!!!!!!!! !!!!!!!!!!!!!!!!!!!!!!
    #######!!!!!!!!! !!!!!!!!!!!!!!!!!!!!!!
    ######!!!!!!!!!! !!!!!!!!! !!!!!!!!!!!!
    ########!!!!!!!!!! !! !!!! !!!!!!!!!!!!!!
    ######!!!!!!!!!!!!! ! ! !!!!!!!!!!!!!!
    ####!!!!!!!!!!!!!! !!!!!!!!!!!!!!!!!
    ##!!!!!!!!!!!!!!!! !!!!!!!!!!!!!!!!!!
    # # ####!!!!!#!!!!!!!!! $$ !!!!!!!!!!!!!!!!!!
    ##############!!!###!!!!!!! $$$ !!!!!!!!!!!!!!!!!!
    ###############!!####!!!! $$$ !!!!!!!!!!!!!!!!!!
    ########################! $$ !!!!!!!!!!!!!!!!!!
    ###################### # !!!!!!!!!!!!!!!!!
    ##################### !!!!!!!!!!!!!!!!!
    ##################### !!!!!!!!!!!!!!!!!
    ####################### !!!!!!!!!!!!!!!!!
    ######################## !!!!!!!!!!!!!!!!!!
    ######################## !! !!!!!!!!!!!!!!!!!!
    ###################### !!!!!!!!!!!!!!!!!!!!!!!!!!!
    ### ################# !!!!!!!!!!!!!!!!!!!!!!!!!!
    ## ################### !!!!!!!!!!!!!!!!!!!!!!!!!
    ##################### !!!!!!!!!!!!!!!!!!!!!!!!!
    #################### !!!!!!!!!!!!!!!!!!!!!!!!!!!
    #################### !! !!!!!!!!!!!!!!!!!!!!!!!!
    ##################### !!!!!!!!!!!!!!!!!!!!!!!
    ###################### !!!!!!!!!!!!!!!!!!!!!!!
    ##################### !!!!!!!!!!!!!!!!!!!!!!!
    ##################### !!!!!!!!!!!!!!!!!!!!!!!
    ######################## !!!!!!!!!!!!!!!!!!!!!!!!
    ###################### !!!!!!!!!!!!!!!!!!!!!!!!!!!
    ################ !!!!!!!!!!!!!!!!!!!!!!!!!!!!!
    ################ !!!!!!!!!!!!!!!!!!!!!!!!!!!!!!
    ############## !!!!!!!!!!!!!!!!!!!!!!!!!!!!!
    ########### !!!!!!!!!!!!!!!!!!!!!!!!!!!!!!
    ########## !! !!!!!!!!!!!!!!!!!!!!!!!!
    ##### !!!! !!!!!!!!!!!!!!!!
    !!!!!!!!!!!!!!!!!!!!
    !! !!!!!!!!!!!!!!!!!
    ! !!!!!!!!!!!!!!!!!!!!!!!!
    ! !!!!!!!!!!!!!!!!!!!!!!!!
    !!!!!!!!!!!!!!!!!!!!!!!!!!
    !!!!!!!!!!!!!!!!!!!!!!!!!!
    !!!!!!!!!!!!!!!!!!!!!!!
    !!!!!!!!!! !!!!! !!
    !!!!!!!!!! !
    !!!!!!!!!!
    !!!!! !!!
    !!!!!
    ! !!
    ! !

    % && &&
    &&&&
    %% &&&&&
    &&&&&&&&&
    '' &&&&&&&&&
    ' &&&&&&&&&
    &&&&&&&&&

    The file also contains a dictionary which maps these characters to the items they represent. Thus, in this particular case the following mappings exist:
    • ! maps to United Kingdom
    • # to the Republic of Ireland.
    • $ to Isle of Man
    • % to Guernsey (I actually have a colleague that lives there)
    • ' to Jersey
    • & to France
    Last, but not least, the file also includes a dictionary with some meta-info for those "objects". For instance, as we're talking about countries it could include stuff like "name", "population", "area", "average earnings", etc.

    Unfortunately there's no support for UTFGrid in Bing Maps, hence the reason for me writing this particular blog post.

    Let me start by showing the end-result. Open the following page:

    Demo #1

    When moving the cursor over the map you should see the name and population of the corresponding country. All of this in real-time without requiring additional round-trips to the server.

    Obviously this could also be useful to represent points. I've added some cities to the previous map on the next example:

    Demo #2

    This example contains a ton of points, but could easily scale to 10 times that. That's the beauty of this approach: as the points are rendered on the images themselves they don't bring any performance impact to the overall map.

    How this was implemented:

    Creating the map itself is outside the scope of this particular post. If you want to can check my previous post on using TileMill here, as the main idea is the same.

    The code should be more-or-less straightforward, but the main parts are:
    • I've declared the UtfGrid using a TileLayer. I've specified a TileSource like this
    var tileSource = new MM.TileSource({
    uriConstructor: function getTilePath(tile) {

    var key = tile.levelOfDetail + "_" + tile.x + "_" + tile.y;

    if(_cache[key] == undefined) {
    loadUtfGridForTile(tile, urlTemplate);
    }

    }});
    var tileLayer = new MM.TileLayer({ mercator: tileSource});
    The idea is to have the getTilePath method call my the utfgrid file and store it locally for each retrieved tile.
    • The request itself is done in JSONP with the reqwest lib.
    • The trickiest code is the one that determines the x/y position of the cursor on a particular tile:

    var zoom = map.getZoom();
    var mouseX = e.getX();;
    var mouseY = e.getY();

    var point = new MM.Point(mouseX, mouseY);

    var loc = map.tryPixelToLocation(point);

    var worldpixel = LatLongToPixelXY(loc.latitude, loc.longitude, zoom);
    var tileX = worldpixel.x / 256.0;
    var tileY = worldpixel.y / 256.0;

    var x = (tileX - Math.floor(tileX)) * 256;
    var y = (tileY - Math.floor(tileY)) * 256;

    Anyway, just view the source of the examples if you need any additional info.

    Next Steps
    I intend to polish this code and package it into a Bing Maps Module, as I believe it could be useful for a ton of scenarios.

    Update (2013-11-16): just created a post with that. Part 2.


    UTFGrid in Bing Maps (Part 2 - Bing Maps Module)

    $
    0
    0
    Part 1 - Introduction
    Part 2 -Bing Maps Module

    On this post I'm adapting my previous UTFGrid code and packaging it into a very easy to use Bing Maps Module.

    I'm going to show a couple of simple demos on how to use it.

    Demo #1 - Basic (try it here)

    Very simple demo. Click a country and an alert message will display its name. All this without any round-trip to the server.

    Note: in all these demos there are only 4 zoom levels of UTFGrid tiles. Thus, if zooming paste the satellite images, nothing should happen when clicking/hovering the map.


    The module is declared similarly to any other Bing Maps module:
     MM.registerModule("UtfGridModule", "js/UtfGridModule.js");
    MM.loadModule("UtfGridModule", {
    callback: function () {
    //CODE
    }});
    The UTFGrid is created specifying the URL template of the tiles:
    var utfGrid = new UtfGrid(map, 'Tiles/World/{z}/{x}/{y}.grid.json');
    Then it's simply added to the map.
    map.entities.push(utfGrid);
    Obviously, as the UTFGrid is all about client-side interaction, just declaring it like this is not that useful. For this particular demo I defined a callback for the mouseclick event:
    var utfGrid = new UtfGrid(map, 'Tiles/World/{z}/{x}/{y}.grid.json', {
    mouseclickCallback: function (result) {
    alert(result.NAME);
    });

    The mouseclickCallback receives a "result" parameter which includes all the metadata associated with the item that is being hovered. For example, tile 4/8/4 (z/x/y) contains the following meta-data:
    "data":{
    "213":{
    "NAME":"Sweden",
    "POP_EST":9059651
    },
    "140":{
    "NAME":"Latvia",
    "POP_EST":2231503
    },
    "74":{
    "NAME":"Finland",
    "POP_EST":5250275
    },
    "64":{
    "NAME":"Denmark",
    "POP_EST":5500510
    },
    "72":{
    "NAME":"Estonia",
    "POP_EST":1299371
    },
    "6":{
    "NAME":"Aland",
    "POP_EST":27153
    },
    "138":{
    "NAME":"Lithuania",
    "POP_EST":3555179
    },
    "171":{
    "NAME":"Norway",
    "POP_EST":4676305
    }
    }
    Thus, the "result" parameter will be an object that contains a field called "NAME" and another one called "POP_EST".

    Demo #2 - Onmouseover (try it here)

    This demos also displays the same world-map but, while moving the cursor, the country name and population are displayed on a floating-div.


    Similarly to what was done for the mouseclick event, on this particular example a callback for mouseover is also defined:
    mouseoverCallback: function (result) {
    if (result == undefined) {
    $("#countryInfo").html('');
    map.getRootElement().style.cursor = "default";
    }
    else {
    var template = _.template($("#countryTemplate").html());
    $("#countryInfo").html(template(result));
    map.getRootElement().style.cursor = "crosshair";
    }
    }

    It uses Underscore's templating engine to change the contents of the floating div.

    Demo #3 - Onmouseover AJAX (try it here)

    The exact same end-result, but instead of fetching the UTFGrid tiles by JSONP uses regular AJAX calls.


    By default, as it's less restrictive, this module loads UTFGrid tiles using JSONP (which was the approach used on the previous examples).

    I've added a parameter that allows changing this behavior so that the tiles may be loaded by regular Ajax calls, which sometimes provides a better performance.

    So, just declare the UTFGrid as:
        var utfGrid = new UtfGrid(map, 'Tiles/World_ajax/{z}/{x}/{y}.grid.json', {
    jsonp:false,
    mouseoverCallback: function (result) {
    //...
    });
    Note: The UTFGrid tiles themselves need to be different for JSONP or Ajax calls, hence why the url template is different on this demo.


    Options

    Here's the full list of supported options for defining an UTFGrid:

    - tileSize (default 4) 
    The size (in pixels) of each UtfGrid element. Thus, for each raster tile of 256x256, by default there will be an accompanying UTFGrid tile of 64x64.

    - maxZoomLevel (default 20): 
    Maximum zoom level until the UtfGrid is applied. For example, if set to 10 it means that will be available from zoom level 0 (the furthest away) to level 10.

    - jsonp (default true):
    Indicates if the tiles should be loaded by JSONP or regular ajax.

    - mouseclickCallback (default undefined):
    callback that is called when there's a click on an UTFGrid tile

    - mouseoverCallback (default undefined):
    callback that is called when hovering an UTFGrid tile

    - tileLoadedCallback (default undefined):
    callback that is executed each time a UTFGrid tile is loaded

    Generating server-side tile-maps with Node.JS (Part 1 - Programatically with Canvas)

    $
    0
    0
    This will be a series of posts on leveraging Node.js to generate tile-images on server-side that will be displayed on top of Bing Maps (although applicable to any other mapping API).

    For those not familiar with it, Node has gained lots of momentum on the web. It provides a simple event oriented, non-blocking architecture on which one can develop fast and scalable applications using Javascript.

    It lends itself really well for generating tile-images and is in-fact being used by some large players like Mapbox.

    On this first post I'm going to generate very simple tiles. I won't fetch data from the database nor do anything too fancy. Each tile will simply consist on a 256x256 png with a border and a label identifying the tile's z/x/y. Conceptually something like this:


    I'm going to use an amazing Node module called Canvas which provides the whole HTML5 Canvas API on server-side. My main reason is that it's an API that I know particularly well and I can reuse lots of my existing code.

    I'm going to develop on Mac OS X but most of this would be exactly the same on Windows or Linux.

    Afterwards, as an extra, I'm also going to provide instructions on how to setup a Linux Virtual Machine in Azure running the resulting node application.

    First things first. I'll setup an bare-bones node application and gradually add more stuff to it.
    Install Node and create a file named server.js with the following content:
    console.log("Hello World");
    Run this node application in a terminal window:
    node server.js

    Not particularly impressive but we now know that Node is working. To return an image I'll use, as mentioned, the Canvas module. Installing the module is simple enough (npm install canvas), but the problem is that it has a dependency on a lib called Cairo. Installing Cairo  requires one to follow a couple of installation steps religiously (includes information for Windows, Linux, Mac OS X, et al.)
    https://github.com/LearnBoost/node-canvas/wiki/_pages

    After installing Cairo and the Canvas module we're ready to start. Let's just generate a simple image on the fly and return it as a server response.

    Update the node server to return an image generated on the fly with Canvas:
    var http = require('http');
    var Canvas = require('canvas');

    var server = http.createServer(function (request, response) {

    var canvas = new Canvas(256, 256)
    var context = canvas.getContext('2d');

    context.beginPath();
    context.rect(0, 0, 256, 256);

    context.lineWidth = 7;
    context.strokeStyle = 'black';
    context.stroke();

    var stream = canvas.createPNGStream();

    response.writeHead(200, {"Content-Type": "image/png"});
    stream.pipe(response);

    });

    server.listen(8000);
    After running this server and pointing the browser to localhost:8000 a simple 256x256 image should be displayed.

    In Node, to create an HTTP Server, a module named Express is invaluable. It provides loads of functionality including a routing engine that I'll use in this demo to obtain the tile's zxy and display it inside the square. You'll have to install it using npm.
    npm install express
    Update the server to parse the request and paint a text with the Z, X, Y
    var express = require('express');
    var Canvas = require('canvas');
    var app = express();

    app.get('/:z/:x/:y', function(req, res) {

    var z = req.params.z,
    x = req.params.x,
    y = req.params.y;

    var canvas = new Canvas(256, 256)
    var context = canvas.getContext('2d');

    context.beginPath();
    context.rect(0, 0, 256, 256);

    context.lineWidth = 7;
    context.strokeStyle = 'black';
    context.stroke();

    context.fillStyle = "darkblue";
    context.font = "bold 16px Arial";
    context.fillText(z + "/" + x + "/" + y, 100, 128);


    var stream = canvas.createPNGStream();

    res.type("png");
    stream.pipe(res);

    });

    app.listen(process.env.PORT || 8000);

    When running the server it will use the url parameters as http://localhost:8000/z/x/y and display them inside the square:

    The last step will be creating an Html page with a Bing Map that uses these tiles.

    index.html
    <!DOCTYPE html PUBLIC "-//W3C//DTD XHTML 1.0 Transitional//EN""http://www.w3.org/TR/xhtml1/DTD/xhtml1-transitional.dtd">
    <html>
    <head>
    <title>Bing Maps Server Tile Layer - Simple Demo</title>
    <meta http-equiv="Content-Type" content="text/html; charset=utf-8"/>
    </head>
    <body onload="loadMap();">

    <div id='mapDiv' style="width:100%; height: 100%;"></div>

    <script type="text/javascript" src="http://ecn.dev.virtualearth.net/mapcontrol/mapcontrol.ashx?v=7.0"></script>
    <script type="text/javascript">

    function loadMap()
    {
    var MM = Microsoft.Maps;
    var map = new MM.Map(document.getElementById("mapDiv"), {
    center: new MM.Location(39.5, -8),
    mapTypeId: MM.MapTypeId.road,
    zoom: 7,
    credentials:"YOUR CREDENTIALS HERE"});

    var tileSource = new MM.TileSource({ uriConstructor: function (tile) {

    var x = tile.x;
    var z = tile.levelOfDetail;
    var y = tile.y;

    return "http://localhost:8000/" + z + "/" + x + "/" + y;
    }});

    var tileLayer = new MM.TileLayer({ mercator: tileSource});
    map.entities.push(tileLayer);
    }

    </script>
    </body>
    </html>
    A map should appear with an additional layer with the generated tiles.

    You can check the end-result here.

    Extra:

    I've deployed the above example in a Linux Virtual Machine on Azure. I'm going to show you the exact steps that I took to do so.


    On the Azure Portal press "Add":


    Choose "Virtual Machine"


    Choose Ubuntu Server 12.04 LTS from the UBUNTU section.


    Fill the details. The Virtual Machine Name will have to be something unique. You'll be assigned an URL like <virtual machine name>.cloudapp.net.


    Instead of using a SSH Key I would suggest, for simplicity, to just set a user name and a password.


    The wizard then asks which ports you want open. The SSH appears by default and is mandatory to be able to manage the machine. I've also configured two HTTP endpoints and one for FTP.


    After finishing the process it should take a couple of minutes to finalise the Virtual Machine.
    Afterwards use a SSH client to access the machine (putty on windows or ssh on Mac OS X):

    ssh <virtual machine name>.cloudapp.net -l <user>
    For my particular example:
    ssh build-failed.cloudapp.net -l pedro

    The first thing to do inside the machine would be to install Node.

    Just run the following commands as recommended on http://kb.solarvps.com/ubuntu/installing-node-js-on-ubuntu-12-04-lts/.
    root@nodepod:~# sudo apt-get update
    root@nodepod:~# sudo apt-get install python-software-properties python g++ make
    root@nodepod:~# sudo add-apt-repository ppa:chris-lea/node.js
    root@nodepod:~# sudo apt-get update
    root@nodepod:~# sudo apt-get install nodejs
    I also had to install Cairo according to the instructions at: https://github.com/LearnBoost/node-canvas/wiki/Installation---Ubuntu
    sudo apt-get update 
    sudo apt-get install libcairo2-dev libjpeg8-dev libpango1.0-dev libgif-dev build-essential g++
    Now, to copy the files I've developed previously on this post I'm going to setup an FTP server on the Virtual Machine. I've used the page at https://help.ubuntu.com/12.04/serverguide/ftp-server.html as reference:
    sudo apt-get install vsftpd
    I will have the FTP configured as:
    • Each local user will have access to the FTP
    • Anonymous access is not allowed
    • Write permission is allowed
    Thus I've edited the configuration at "/etc/vsftpd.conf" (sudo nano /etc/vsftpd.conf) with:
    anonymous_enable=NO
    local_enable=YES
    write_enable=YES
    Now just restart the FTP server and you should be set to go:
    sudo restart vsftpd
    Now just copy the files over to the server and execute the app with a "&" for it to run in the background.
    node server.js &
    I've actually updated the server.js code slightly so that it includes:
    - compression
    - cache headers
    - a route to serve the index.html file.

    The complete server.js should be:
    var express = require('express');
    var Canvas = require('canvas');
    var app = express();

    app.use(express.compress());

    app.get('/', function(req,res) {
    res.sendfile('public/index.html');
    });

    app.get('/:z/:x/:y', function(req, res) {

    res.setHeader("Cache-Control", "max-age=31556926");

    var z = req.params.z,
    x = req.params.x,
    y = req.params.y;

    var canvas = new Canvas(256, 256)
    var context = canvas.getContext('2d');

    context.beginPath();
    context.rect(0, 0, 256, 256);

    context.lineWidth = 7;
    context.strokeStyle = 'black';
    context.stroke();

    context.fillStyle = "darkblue";
    context.font = "bold 16px Arial";
    context.fillText(z + "/" + x + "/" + y, 100, 128);

    var stream = canvas.createPNGStream();

    res.type("png");
    stream.pipe(res);

    });

    app.listen(process.env.PORT || 8000);

    Generating Server-side tile maps with Node.js (Part 2 - Using Mapnik)

    $
    0
    0

    On my previous post I've shown how to use node.js to generate server-tiles, painting them "manually" using the canvas API. This is perfect for those scenarios where one wants to overlay dynamic or custom data on top of an existing map. The following images (although done on client-side with canvas) are good examples of this:


    Now, suppose we don't want to generate data on top of a map but the map itself. Meaning, a tile more or less similar to this:
    This is very complex as it requires loading spatial data, painting the countries, roads, rivers, labels, always taking into account the zoom level, etc. Not trivial at all.


    Fortunately there are some frameworks/toolkits that provide some assistance in achieving this. The most notorious one is probably mapnik.

    Mapnik provides a descriptive language in XML supporting an incredibly rich feature-set. It can read data from multiple sources, apply various transformations and has lots of cosmetic options. The problem is that this configuration becomes really hard to manage. The easiest way to create this XML is, IMHO, using TileMill (which I've already discussed on an older post).

    I'm going to create an incredibly basic map using TileMill, export the Mapnik XML file, create a tile-server using node and Mapnik and show the resulting map on Bing Maps.

    Step 1: Open TileMill

    Step 2: Create a new project, calling it "Simple"


    The default map already contains a world map layer which should be enough for the sake of this post.


    I've changed the colour of the countries using the style editor on the right. Basically I'm just throwing around some colours to make it less bland.

    Map { background-color: #5ac2d7; }

    #countries
    {
    [MAP_COLOR=0] { polygon-fill: gray }
    [MAP_COLOR=1] { polygon-fill: purple }
    [MAP_COLOR=2] { polygon-fill: green }
    [MAP_COLOR=3] { polygon-fill: yellow }
    [MAP_COLOR=4] { polygon-fill: navy }
    [MAP_COLOR=5] { polygon-fill: blue }
    [MAP_COLOR=6] { polygon-fill: darkblue }
    [MAP_COLOR=7] { polygon-fill: black }
    [MAP_COLOR=8] { polygon-fill: pink }
    [MAP_COLOR=9] { polygon-fill: brown }
    [MAP_COLOR=10] { polygon-fill: darkgreen }
    [MAP_COLOR=11] { polygon-fill: darkgray }
    [MAP_COLOR=12] { polygon-fill: gainsboro }
    [MAP_COLOR=13] { polygon-fill: orange }
    }

    Yep, an awful looking map :)


    By the way, if you want a great tutorial on styling a map on TileMill check this crash-course created by Mapbox.

    Now, to create the corresponding Mapnik file just press the "Export > Mapnik XML" button.


    I'm saving it on a "Data" folder that will be a sibling to my node app.

    Step 3: Install the required components

    First things first. We need (besides Node obviously):
    • Mapnik
    • Node Mapnik module
    I'm actually writing this post in a MacOSX computer and my instructions will be targeted at this OS.
      • Updating the PYTHONPATH environment variable
    Edit the .bash_profile file (I'm using nano on the terminal window but any editor will do):
    pico ~/.bash_profile
    Add the following line to the file:
    export PYTHONPATH="/usr/local/lib/python2.7/site-packages"
    For reference, this is what my .bash_profile file looks like
      • Now, to make sure that Mapnik is in fact working, open a Python window and just run the "import mapnik" command. If no error appears it should be properly installed.
    • Install the Node Mapnik module
    npm install mapnik
    • Install the Express module
    npm install express
    Step 4: Create the node code

    I'm going to create a really basic server. It parses the x,y,z parameters of the URL, creates a mapnik map based on the XML file created in step 2 and sets the map boundaries to the corresponding coordinates of the map tile.

    It will be built using the previous post as a starting-point, were I had an express server set up.

    The full code is:
    var express = require('express');
    var app = express();
    app.use(express.compress());

    var mapnik = require('mapnik');
    mapnik.register_datasources("node_modules/mapnik/lib/binding/mapnik/input");

    var mercator = require('./sphericalmercator');

    var stylesheet = './Data/Simple.xml';

    app.get('/', function(req,res) {
    res.sendfile('./Public/index.html');
    });

    app.get('/:z/:x/:y', function(req, res) {

    res.setHeader("Cache-Control", "max-age=31556926");

    var z = req.params.z,
    x = req.params.x,
    y = req.params.y;

    var map = new mapnik.Map(256, 256);

    map.load(stylesheet,
    function(err,map) {
    if (err) {
    res.end(err.message);
    }

    var bbox = mercator.xyz_to_envelope(x, y, z, false);
    map.extent = bbox;

    var im = new mapnik.Image(256, 256);
    map.render(im, function(err,im) {
    if (err) {
    res.end(err.message);
    } else {
    im.encode('png', function(err,buffer) {
    if (err) {
    res.end(err.message);
    } else {
    res.writeHead(200, {'Content-Type': 'image/png'});
    res.end(buffer);
    }
    });
    }
    });
    }
    );
    res.type("png");
    });

    app.listen(process.env.PORT || 8001);

    console.log('server running');

    Running the server locally:
    node App/server.js
    Opening a browser window to validate the result:

    Some important bits:
    • For some reason the datasources couldn't be loaded on mapnik, hence the specific "register_datasources" command
    • I'm also serving the static Index.html file, which loads the tiles. The complete code for the client is mostly the same of the one from my last post:
    <!DOCTYPE html PUBLIC "-//W3C//DTD XHTML 1.0 Transitional//EN""http://www.w3.org/TR/xhtml1/DTD/xhtml1-transitional.dtd">
    <html>
    <head>
    <title>Bing Maps Mapnik Layer - Simple Demo</title>
    <meta http-equiv="Content-Type" content="text/html; charset=utf-8"/>
    </head>
    <body onload="loadMap();">

    <div id='mapDiv' style="width:100%; height: 100%;"></div>

    <script type="text/javascript"
    src="http://ecn.dev.virtualearth.net/mapcontrol/mapcontrol.ashx?v=7.0">
    </script>
    <script type="text/javascript">

    function loadMap()
    {
    var MM = Microsoft.Maps;
    var map = new MM.Map(document.getElementById("mapDiv"), {
    center: new MM.Location(39.5, -8),
    backgroundColor: MM.Color.fromHex('#5ac2d7'),
    mapTypeId: MM.MapTypeId.mercator,
    zoom: 3,
    credentials:"YOUR CREDENTIALS"});

    var tileSource = new MM.TileSource({ uriConstructor: function (tile) {

    var x = tile.x;
    var z = tile.levelOfDetail;
    var y = tile.y;

    return "/" + z + "/" + x + "/" + y;
    }});

    var tileLayer = new MM.TileLayer({ mercator: tileSource});
    map.entities.push(tileLayer);
    }
    </script>
    </body>
    </html>

    You can check the end-result here.


    Extra:

    As I did on my previous post, I'm going to show the required steps to deploy this to a Linux Virtual Machine on Azure.

    I'll just pick up where I left, which already included setting up an FTP server, the proper accesses and NodeJS.

    I'll start by opening an additional port. I've already used 8000 for my previous demo so I'll use 8001 for this one.


    Now for the missing pieces:
    • Install Mapnik
    sudo apt-get install -y python-software-properties
    sudo add-apt-repository ppa:mapnik/v2.2.0
    sudo apt-get update
    sudo apt-get install libmapnik libmapnik-dev mapnik-utils python-mapnik

    node-mapnik requires protocol buffers to be installed, which in turn requires the g++ compiler. The complete set of required commands is:
    • Install g++
    sudo apt-get update
    sudo apt-get upgrade
    sudo apt-get install build-essential
    gcc -v
    make -v
    • Install protobuf
    Download source file from here. Extract to some folder and run the following commands inside it.
    sudo ./configure
    sudo make
    sudo make check
    sudo make install
    sudo ldconfig
    protoc --version
    • Install node-mapnik (inside the folder for the server)
    npm install mapnik
    • Set locale-gen
    export LC_ALL="en_US.UTF-8"
    Now, assuming everything is copied over to Azure (including the shapefile, the mapnik xml, the node server-code) running the server in background will be as simple as:
    node App/server.js &
    And that's it.

    Game-development Log (1. Introduction + WebAPI for map tiles)

    $
    0
    0

    Although my blog has been mostly dormant for the last few months I've kept myself busy making various experiments with mapping and gaming. I've expanded some of the ideas that I've already posted and I've prototyped some new stuff.

    My intent: to create a massive online strategy game where there's a single shared persistent battleground and a pseudo-realtime gameplay mechanic. Yeah, lots of fancy words without saying much, but if it all goes as planned could be quite interesting. In a worst case scenario should be fun to build.

    My plan is to document the progress on my blog (particularly as what I have now are mostly disconnected pieces) and deploy the new iterations as frequently as possible.

    Technology
    After some careful consideration I've decided to go with the following technologies:
    • Bing Maps for all the client-side mapping interaction. I've got tons of code on this but I still have some challenges around scalability and rich interaction elements like explosions and stuff. 
    • C#, although Javascript on Node was a great candidate and most of my prototypes were done on it. My final decision on C# was mostly due to my higher proficiency on it and to the fact that I intend to create a client in Unity (that's the plan, one can dream).
    • Azure, as it maps really well to the scale and roadmap I'm trying to achieve. Also, it gets better everyday and I plan to use lots of its capabilities including web-sites, table-storage, blobs, redis, sql server, message-bus, etc.


    First Iteration - Server-side tiles generated on ASP.NET MVC WebApi

    I don't want to unveil too much right now (particularly as everything is highly likely to change) but the target for my first iteration is simply a map that displays server-side generated tiles with hexagons.


    I'm going to use ASP.NET MVC WebAPI 2 for this.

    The solution consists on:
    • Creating a TileController that handles routes such as /tile/{z}/{x}/{y}.png
    • Returning a "HexagonTile" model
    • Creating custom formatters that are able to convert an "HexagonTile" to the destination formats, like images.
    • Displaying the tiles on Bing maps, overlaid with the base maps.
    The WebAPI action will be defined as:
    public HexagonTile Get(int z, int x, int y)
    {
    var tile = new HexagonTile {
    {
    Z = z,
    X = x,
    Y = y;
    };
    return tile;
    }

    Eventually another option for this would be to declare the action as:
    public HttpResponseMessage Get(int z, int x, int y)
    {
    // (...)
    MemoryStream dataStream = new MemoryStream(resourceByteArray);
    HttpResponseMessage response = new HttpResponseMessage(HttpStatusCode.OK);
    response.Content = new StreamContent(dataStream);
    response.Content.Headers.ContentType = new MediaTypeHeaderValue("image/jpeg");
    return response;
    }
    (ex: http://stackoverflow.com/questions/21567052/return-images-to-web-page-using-web-api)

    But in my opinion this would be a sub-optimal approach as it's breaking the usefulness of HTTP and best-practices when creating a WebApi . The action should, in theory, just return the model. Either returning json, an image, a bson or any other format should leverage the HTTP protocol, like through the HTTP Accept headers.

    Thus I'm using the first option and associating specific accept headers with different formatters on my web api configuration:
    public static void Register(HttpConfiguration config)
    {
    var imageFormatter = new TileImageFormatter();
    imageFormatter.MediaTypeMappings.Add(
    new UriPathExtensionMapping(
    "png",
    new MediaTypeHeaderValue("image/png")));
    config.Formatters.Add(imageFormatter);

    var jsonFormatter = new TileJsonFormatter();
    jsonFormatter.MediaTypeMappings.Add(
    new UriPathExtensionMapping(
    "json",
    new MediaTypeHeaderValue("application/json")));
    config.Formatters.Add(jsonFormatter);

    // Web API routes
    config.MapHttpAttributeRoutes();

    config.Routes.MapHttpRoute(
    name: "DefaultApi",
    routeTemplate: "api/{controller}/{id}",
    defaults: new { id = RouteParameter.Optional }
    );
    }

    Note: The "UriPathExtensionMapping" allows the output format to be overwriten by passing an extension on the route.

    For reference, this is my TileImageFormatter source-code:
    public class TileImageFormatter : MediaTypeFormatter
    {
    private readonly ITileGenerator _tileGenerator;

    public TileImageFormatter(ITileGenerator tileGenerator)
    {
    _tileGenerator = tileGenerator;
    SupportedMediaTypes.Add(new MediaTypeHeaderValue("image/png"));
    }

    public override bool CanReadType(Type type)
    {
    return typeof(HexagonTile) == type;
    }

    public override bool CanWriteType(Type type)
    {
    return typeof(HexagonTile) == type;
    }

    public override async Task WriteToStreamAsync(
    Type type,
    object value,
    Stream writeStream,
    HttpContent content,
    TransportContext transportContext)
    {
    var tile = value as HexagonTile;
    if (tile == null)
    throw new InvalidOperationException("Invalid Type!");

    using (var bmp = _tileGenerator.RenderTile(tile)
    {
    var memStream = new MemoryStream();
    bmp.Save(memStream, ImageFormat.Png);
    byte[] bytes = memStream.ToArray();
    await writeStream.WriteAsync(bytes, 0, bytes.Length);
    }
    }
    }

    Note: The image rendering logic is encapsulated in the TileGenerator class, although not that interesting to show here, particularly as it's using GDI+ to generate the tile and I need to find a better alternative.

    The routes themselves are defined at the action level using the Route attributes from WebAPI 2:
    [Route("v1/tile/{z:int}/{x:int}/{y:int}.{ext}")]
    [Route("v1/tile/{z:int}/{x:int}/{y:int}")]
    public HexagonTile Get(int z, int x, int y)
    This basically means that a request for "v1/tile/12/1940/1565" will be handed by this action, as will the requests that include the optional extensions, as in "v1/tile/12/1940/1565.png" or "v1/tile/12/1940/1565.json".

    I've already deployed this to Azure. Some example requests are:

    http://tile-win.azurewebsites.net/v1/tile/10/490/391.png

     Should return this image:

    Issuing the request:
    http://tile-win.azurewebsites.net/v1/tile/10/490/391.json

    Should return the json representation of those hexagons.

    I've deployed a simple Bing Maps that's using this tile layer. This will be just the starting point as I don't plan to deliver the tiles completely on-the-fly with GDI+.

    You can see it in action here:
    http://site-win.azurewebsites.net/Map/V1

    On my next iteration I'm going to delve on the data loader tool. It loads real data from various GIS sources so that the hexagons can represent land, roads, rivers, etc.

    I've not yet decided on how I'm going to store the parsed data afterwards, but I'm tending for the option of pre-generating vector tiles with the meta-data.  Anyway, more on that later :)


    Game-development Log (2. Visual Studio Online)

    $
    0
    0

    IMHO a project needs planning/tracking. I'm all pro-Agile, but using that as an excuse to avoid any analysis, documentation and tracking is a common mistake. Also, it's very hard to deliver working software without a proper release cycle. With that said, one could argue that for a single-person project this isn't by any means a requirement. Regardless, I plan to do it and I'll try to follow a professional approach to building this game (which sometimes isn't particularly easy as I'm doing it on my free time after both my kids have gone to bed :D).

    I'm using Visual Studio Online for work-items/release management and source-control, including its link to Azure.

    So what's Visual Studio Online?

    Wikipedia definition is quite good:

    "Visual Studio Online is a hosted application lifecycle management service from Microsoft. The service consists of tools for project management, source control and a build service.

    The service is based on Team Foundation Server and was originally launched as Team Foundation Service in 2012."


    Basically it's TFS on the cloud and integration with Azure for deployment/testing.


    Setting everything up was very simple and the integration with VS 2013 is, as expected, top-notch. I've also prepared my short term Product Backlog Items and created some iterations (I'm avoiding calling them Sprints), which I plan to sync with the posts that I do around my progress.

    My next release will be:


    I've used TFS professionally quite a lot in the past and always loved the "integrated" part of it, where one would commit code and link it to work-items. Regardless, I've always disliked its source-control. Fortunately the good lads at Microsoft decided to give developers the option to use GIT, which I'm gladly using on this project.

    So, shorter post than usual, now back to coding :)

    Game-development Log (3. Loading data to Vector Tiles)

    $
    0
    0

    On this iteration I'm loading some geographical data, converting it to hexagons and exporting vector tiles with the resulting information.

    Loading Data

    Creating the loader process has been an incredibly empirical process as I've experimented tons of approaches, never quite happy with them.

    The road so far
    Supernatural reference :)

    Geographical data on the Database
    Initially, as posted on one of my blog posts, I simply loaded geographical data and stored it "as is" on a Geographical column in Sql Server. Then, I had a WebAPI that would make a geographical query for all the features included on a certain area (matching the viewport). Additional calculations were then made in client-side to calculate the intersection between the hexagons and the geographical features.

    I even posted a video of this:

    But, as I explained on the video, this was a sub-optimal approach, as I was wastefully making tons of unnecessary calculations and ideally some of them would need to be pre-calculated and stored. Also, this approach wouldn't scale well for the whole world, just for small areas created "on-demand".

    Redis on Node
    After some intermediate experiments I then decided to store the pre-calculated hexagon data on a key-store, where I opted for Redis. I even implemented it on Node, although I haven't blogged about it. The results were pretty interesting although not easily scalable, mostly as the key-value nature of Redis didn't map to the queries I needed to do. Also, as Redis loads everything into memory (although having persistence options) this wasn't scalable from a financial point of view, as RAM is very expensive on the Cloud and I would need tons of memory to map the whole world with hexagons.

    Azure Table Storage on Node
    Azure Table Storage seemed a good candidate to store the hexagon data. Scales well, has great performance, is cheap and lends itself well to store the hexagon data. I even created a Proof-of-concept that used Azure Table Storage, but this was turning out to be a difficult task, particularly as the node client is not perfect and the loading process took ages to complete, even for a small portion of the world. Regardless, using Table Storage could be a viable option, I just need to solve some challenges.

    C#
    Recently I've decided to redo the loader in C# and this turned out to be good bet. Besides having better performance, I ended up with a much better architecture, allowing me to experiment different alternatives that would suit the problem better.

    Currently I'm trying two different options in parallel:

    - Setting up a CDN on Azure that has its origin set to a Cloud-Service that hosts an WebAPI that's fetching hexagon data from Azure Table Storage. 

    and

     - Storing Vector Tiles on a blob storage and serve them directly to the web-clients, eventually through a CDN. 

    So, summing up, the main argument will be on using an origin-pull CDN or a push CDN. To narrow down the scope of this post I'm just going to discuss the Vector Tiles implementation where I push the vector tile files to the Cloud.

    Vector Tiles

    So, what's a vector tile?

    I'm quoting the definition found on OSM (http://wiki.openstreetmap.org/wiki/Vector_tiles)

    "Vector tiles are a way to deliver geographic data in small chunks to a browser or other client app. Vector tiles are similar to raster tiles but instead of raster images the data returned is a vector representation of the features in the tile. For example a GeoJSON vector tile might include roads as LineStrings and bodies of water as Polygons. Some vector tile sources are clipped so that all geometry is bounded in the tiles, potentially chopping features in half. Other vector tile sources serve unclipped geometry so that a whole lake may be returned even if only a small part of it intersects the tile."

    In my case, for each corresponding map tile I generate a JSON file that defines the type of hexagons that are present on that particular tile (like roads or forests) but without any style information (colours, widths and such). The important detail is that I won't (at least for now) generate raster tiles, only vector tiles. Then I can generate the tile images on the fly, either on the server (like on my previous post using GDI+) or on the client (for example using HTML5 Canvas as I had done before).

    How does the loader process work and were does the Vector Tile generation take place?

    The high-level loader process is like this:
    • I have various sources of data. Currently I support GeoJson and the XYZ format (which is basically an ascii file with Lat, Lon and a numerical value).
    • The data is loaded and converted to hexagon data in-memory, processing each type of information separately (roads, land, rivers, railroads, altitude, forests, etc).
    • After loading all the info I run various post-processing commands (using a plugin architecture) as some values are extrapolated from various layers (more on this on future posts).
    • The data is then exported to tiles.
      • Iterating each hexagon it's very simple to determine with map tiles contain it (basically as simple as dividing the pixel coordinates of the hexagon's bounding box by 256).
      • Vector Tiles are generated including all the related hexagon data.
      • The files are copied to the target location. Could be local storage or blob storage.
    Note: As I'm using simple json files I can generate them locally and then just copy them around. I don't need to install my loader process on Azure, which is very practical as my local machines are much faster (and cheaper) than the Web-Roles that I typically spawn on Azure. 

    So, right now I've already exported some tiles to Azure Blob Storage, which you can validate using the following links:

    https://wintiles.blob.core.windows.net/hexagons/031332322.json

    https://wintiles.blob.core.windows.net/hexagons/031332330.json

    https://wintiles.blob.core.windows.net/hexagons/0331103011.json

    Another detail worth mentioning is that fact that I've added support for the Quadkey representation of tiles (used above), which lends itself better to blob-storage as subfolders are not supported.

    The data inside these vector tiles might include:

    • Land (bool)
    • Roads
      • Mask with 6 bits, one for each edge of the hexagon
    • River
      • Mask with 6 bits, one for each edge of the hexagon
    • Urban (bool)
    • Forest (bool)
    • Water (bool)
    • Level (int)
      • Normalised altitude

    That's it for now. Next-step: generating image-tiles based on this info.


    For reference, other notable examples of Vector Tiles:

    Mapnik Vector Tiles: http://openstreetmap.us/~migurski/vector-datasource/

    MapBox Vector Tiles: https://www.mapbox.com/blog/vector-tiles/

    Game-development Log (4. Rendering image tiles)

    $
    0
    0

    New iteration, tons of new stuff:
    • Create a mixed-approach for the problem of having data pre-generated vs generated on-the-fly
    • Binary Vector Tiles
    • Render image tiles
    • Blending with Bing Maps
    • Improved loader process to fix/optimize roads and railways


    So, let me explain each of these items:

    Create a mixed-approach for the problem of having data pre-generated vs generated on-the-fly

    On my previous posts I presented one of my major concerns: choosing a proper data-store for the hexagon data. I thought about Redis, Table Storage or eventually pre-generating the whole lot: both vector tiles and image tiles.
    On my last post I was tending to just generate the vector tiles and generate the image tiles dynamically. As I was implementing it I had an even better idea:
    • Store the vector tiles for the furthest way zoom level (in my case 7) on the Azure blob-storage.
    • Then, when a zoom level other than 7 is requested, simply dividing consecutively by 4 provides the required tile, due to the nature of the map-tiles.
    Reference: Bing Maps Tile System
    Just to provide some comparison data on the impact of this, if I stored the whole world in zoom level 7 that would correspond approximately to 20.000 tiles, which is pretty reasonable. Storing everything until level 13 (which is what I plan to support) would require about 90.000.000 tiles. But even worse than the space occupied would be the time required to generate all these tiles. Without a proper infrastructure it could take months, with the added impact of making changes nearly impossible.

    Performance-wise I'm currently quite happy with the loader process. Loading terrain, altitude, roads, railways, forests, country-info and urban areas for Portugal (including persisting the vector tiles on Azure Blob Storage) takes about 30 seconds. Not brilliant but not a bottleneck. Eventually loading big countries like the United-States could take a couple of hours.

    Note: To optimise it even further I only store the vector-tiles that contain any data. Eventually, when I've mapped the whole world, only about 1/3 will require tiles as 2/3 is water.

    Binary Vector Tiles

    On my first approach the vector tiles were being stored on Azure Blob Storage as text/json. I then changed the implementation to also support binary data. The results were satisfactory: less size occupied on the blob storage (and on the wire when uploading) and faster serialization/deserialization. I still support the JSON format but the default is now the binary one.


    Added Drawing-logic to generate image tiles

    On my previous post I've described what a vector tile is. For example, a simple one:

    http://tile-2.azurewebsites.net/v2/tile/11/975/785.json

    Inspecting the content one can see that it has various info, including a road element (with a numerical element that represents a mask with the edges that are crossed by the road)


    I've implemented the image rendering mechanism. The corresponding tile-image for this vector tile is:

    http://tile-2.azurewebsites.net/v2/tile/11/975/785.png


    Other examples of image tiles generated on-the-fly based on the Vector Tiles:
    http://tile-2.azurewebsites.net/v2/tile/10/491/388.png
    http://tile-2.azurewebsites.net/v2/tile/8/122/95.png


    http://tile-2.azurewebsites.net/v2/tile/11/974/779.png
    http://tile-2.azurewebsites.net/v2/tile/9/245/193.png
    It's important to note that this is not the final look&feel for the image tiles. I plan to experiment with textures, eventually loading different terrain types (like crops, desert), etc.


    I'm currently supporting:


    Forests


    Roads, including intersections. I'm currently just loading motorways.


    Altitude information, currently shading the hexagons according to this value. In the short-term I'm going to do something different, eventually on my next blog post.


    Railways, following a similar logic to the roads


    Urban areas. This is a little bland and I'm not exactly sure on how to make this represent urban-like stuff.


    The most basic info of all: land.


    I've got tons of other ideas, like displaying labels, cities, borders, administrative areas.

    Blending With Bing Maps

    As I've mentioned above, I only generate hexagon tiles from zoom level 7. Below that (i.e, with lower zoom levels) the hexagon edge size wouldn't even be 1 pixel wide thus not making much sense to display them. Thus, one of my concerns was:

    "What map layer should I display between zoom level 0 and 6?"

    I thought on various alternatives, including generating my own tiles from real vector data (using TileMill / Mapnik) or splitting a real satellite image. Anyway, the most important requirement was tha between zoom 6 and 7 the transaction needed to be as seamless as possible.

    Then I had a cool idea:

    Between zoom levels 7 and 10 blend my hexagons with the Bing Maps colors on the the various components: water, land, forests and roads.

    So, here's the effect while zooming out:

    Unaltered

    Colours start fading

    The hexagons are now much brighter, mostly noticeable on the forest hexagons.

    Most of the colours are now pretty much similar to the Bing maps ones

    The hexagon layer is hidden and the Bing Maps imagery is displayed

    Still not perfect but good enough for now.


    Improved loader process to fix/optimize roads and railways

    One of the problems that I had with the roads and railways was the fact that, as the hexagons have a finite range of options for displaying roads it's incredibly likely that lots of strange hexagons are generated, particularly as the process is totally automatic.


    A picture is better than a thousand words, so take a look a this example. Portugal is actually a great candidate for this problem as it has an incredible amount of motorways given its small size:


    I've created a "road-fixer" process that cleans-up the roads. After execution the same area now looks like this:


    Not perfect but MUCH better.

    I've deployed all of this on Azure. You can try it out at: http://site-win.azurewebsites.net/Map/V2


    Note: Randomly some tiles are generated without any data. That's a GDI+ problem that I haven't yet fixed

    Game-development Log (5. CDN Caching for map tiles)

    $
    0
    0

    The map that was displayed on my previous post was using an Azure Web-Site to render the tiles. On this iteration I've included a CDN so that the tiles are cached and the latency is minimal when serving them.

    Generically speaking this is my target architecture including a CDN:


    1. The map displayed on the browser requests a tile to the CDN
    2. The CDN checks if it contains the image or not
    3. If not, it queries the tile-server for that particular image
    4. The Tile Server generates it as described on my previous post
    5. The CDN stores the image tile 
    6. The CDN returns the image to the browser

    So, here's the recipe on how to setup this on Azure:

    1. Create a Cloud-Service instead of a Web-Site for the Tile-Server

    First, why a cloud-service and not a web-site? Basically a limitation on Azure CDN itself:

    "The origin domain is the location from which the CDN caches content. The origin domain can be either a storage account or a cloud service;" 
    http://azure.microsoft.com/en-us/documentation/articles/cdn-how-to-use/

    Anyway, not really fond of Cloud-Services but in my particular case it might be a blessing in disguise, especially as I'm generating tiles with GDI+ and I might want to try using other technologies that require installing stuff on the server, which you simply can't do with Web-Sites.

    Regardless, publishing a Web-API to a Cloud-Service is incredibly easy inside Visual Studio 2013. Just follow these steps (taken from http://msdn.microsoft.com/en-us/library/azure/hh420322.aspx):


    I've published it as "tilewin" and it now appears properly on my Azure Management Portal


    To validate that it's working just open the url: http://tilewin.cloudapp.net/v2/tile/10/490/391.png


    2. Create a new "cdn" route on the tile-server webapi

    This is an interesting one. According to Azure documentation to have a Cloud-Service be used as pull-origin for CDN it has to provide a "/cdn" route.

    "Can I use different folder names in the Windows Azure CDN?
    (...)
    For hosted-service object delivery as of SDK 1.4, you are restricted to publishing under the /cdn folder root on your service." (http://azure.microsoft.com/blog/2011/03/18/best-practices-for-the-windows-azure-content-delivery-network/)

    Also, if you recall, a tile-request was something in the likes of:


    Simply adding a "/cdn" at the beginning of the route won't work. Thus, it will need to receive the params through query-string. So, I'm trying to support a route such as:


    Fortunately with WebAPI 2.0 this is a breeze. First I've defined the new action as:
    [Route("cdn")]
    public async Task<VectorTile> GetTile([FromUri]int z,[FromUri]int x,[FromUri]int y)
    {
    var tile = await _tileLoader.LoadVectorTileAsync(z, x, y);
    if (tile == null)
    {
    throw new HttpResponseException(HttpStatusCode.NotFound);
    }
    return tile;
    }
    Also, to support the "type" parameter I had to change my MediaTypeMappings to include QueryStringMapping:
    var imageFormatter = new TileImageFormatter((ITileGenerator)config
    .DependencyResolver
    .GetService(typeof(ITileGenerator)));

    imageFormatter.MediaTypeMappings
    .Add(new UriPathExtensionMapping(
    "png", new MediaTypeHeaderValue("image/png")));

    imageFormatter.MediaTypeMappings.Add(
    new QueryStringMapping(
    "type", "png", new MediaTypeHeaderValue("image/png")));

    config.Formatters.Add(imageFormatter);

    Afterwards I re-published the Cloud Service and the following url now works:

    http://tilewin.cloudapp.net/cdn?z=10&x=490&y=391&type=png


    3. Create and configure the Azure CDN

    I've created a new CDN entry specifying the Cloud Service as the origin and making sure that Query String is enabled.


    Now issuing a request for the CDN (without including the "/cdn" on the url) returns an image tile:

    http://az665126.vo.msecnd.net/?z=10&x=490&y=391&type=png

    I've already made a simple performance comparison on obtaining the tile directly from the Cloud-Service vs CDN. The latency on the CDN one is awesome (as expected). Also, I had setup Output cache on the Cloud-Service. Otherwise the difference would be even greater.


    So, now ready to setup the map.


    4. Change the Map to use the CDN

    Now that's the easy one. I've just replaced the URL from

    http://tile-win.azurewebsites.net/v2/tile/{z}/{x}/{y}.png
    to
    http://az665126.vo.msecnd.net/?z={z}&x={x}&y={y}&type=png

    Trying out the map live at Azure: http://site-win.azurewebsites.net/map/V3


    Game-development Log (6. Adding units and basic interaction)

    $
    0
    0

    Time to make things more interesting by adding some interactive units to the map. Pretty beefy update that, although highly hardcoded on some places, should lay the foundation for what's to come.

    Let me start by showing the end-result and then I'll break it down to the various bits that form it.

    Live URL: http://site-win.azurewebsites.net/Map/V4

    Also, a small video showcasing what's currently deployed on Azure.
    • Loading units
    I've created an hardcoded WebAPI that returns game units. Currently its code is simply:
    public IEnumerable<Unit> Get()
    {
    return new[]
    {
    new Unit
    {
    Id = Guid.NewGuid(),
    Type = "TANK",
    U = 8295,
    V = 1643,
    UserId = Guid.NewGuid()
    },
    new Unit
    {
    Id = Guid.NewGuid(),
    Type = "TANK",
    U = 8291,
    V = 1640,
    UserId = Guid.NewGuid()
    },
    new Unit
    {
    Id = Guid.NewGuid(),
    Type = "HELICOPTER",
    U = 8296,
    V = 1641,
    UserId = Guid.NewGuid()
    },
    };
    }

    It returns three units: two tanks and one helicopter. I've created custom pushpins to represent both concepts.


    My objective is to allow the user to drag these units on the map taking into account the surrounding terrain. Thus I'll have to load the hexagon vector data to the Javascript client.
    • Loading Vector Data to the client
    I simply need to load the vector tiles that I talked about so much on my previous posts. This way the vector tiles will serve two separate purposes:
    • Used as the datasource for generating image-tiles in server-side
    • Used as terrain info on client-side
    This is implemented in a simple way. I created a dummy Bing Maps tile-layer that, instead of returning images, loads vector data from the tile-server and stores it in memory.
    var tileSource = new MM.TileSource({

    uriConstructor: function getTilePath(tile) {

    var z = tile.levelOfDetail;
    var x = tile.x;
    var y = tile.y;

    loadVectorTile(z,x,y);

    }
    });

    var vectorData = new MM.TileLayer({ mercator: tileSource});
    map.entities.push(vectorData);

    As I was requesting tiles from a different server that doesn't support CORS properly (in this case the CDN) the ajax request was failing, leading me to a cross-domain "duh" facepalm moment. So, JSONP for the rescue.
    • Adding JSONP support
    I've added a new option on the vector tiles routes. If a "callback" parameter is passed (and an optional type=jsonp just for verbosity) the response, instead of being a plain JSON, is returned as JSONP. That's basically wrapping the json inside a function call like:

    function_call_name( {{ original json }})

    ex (from the CDN):
    http://az665126.vo.msecnd.net/?z=12&x=1945&y=1565&type=jsonp&callback=vector

    In this particular case the data is wrapped on a "vector" function:


    • Movement
    Now that I have the vector information in client-side I simply register the Bing Maps event handlers on the units and add some lots of logic on them.

    While dragging the unit I display the various movement alternatives and the path that's used to reach the destination.

    Tanks and helicopters have different movement capabilities:

    Tanks can move 4 hexagons on a road and 1 hexagon off-road

    Helicopters have no movement restrictions and can move 6 hexagons on any direction.
    Eventually the units will have a cooldown period after moving.

    So, that's it for now. Next stop: probably attack-logic :)

    Viewing all 63 articles
    Browse latest View live